
10q10k.net
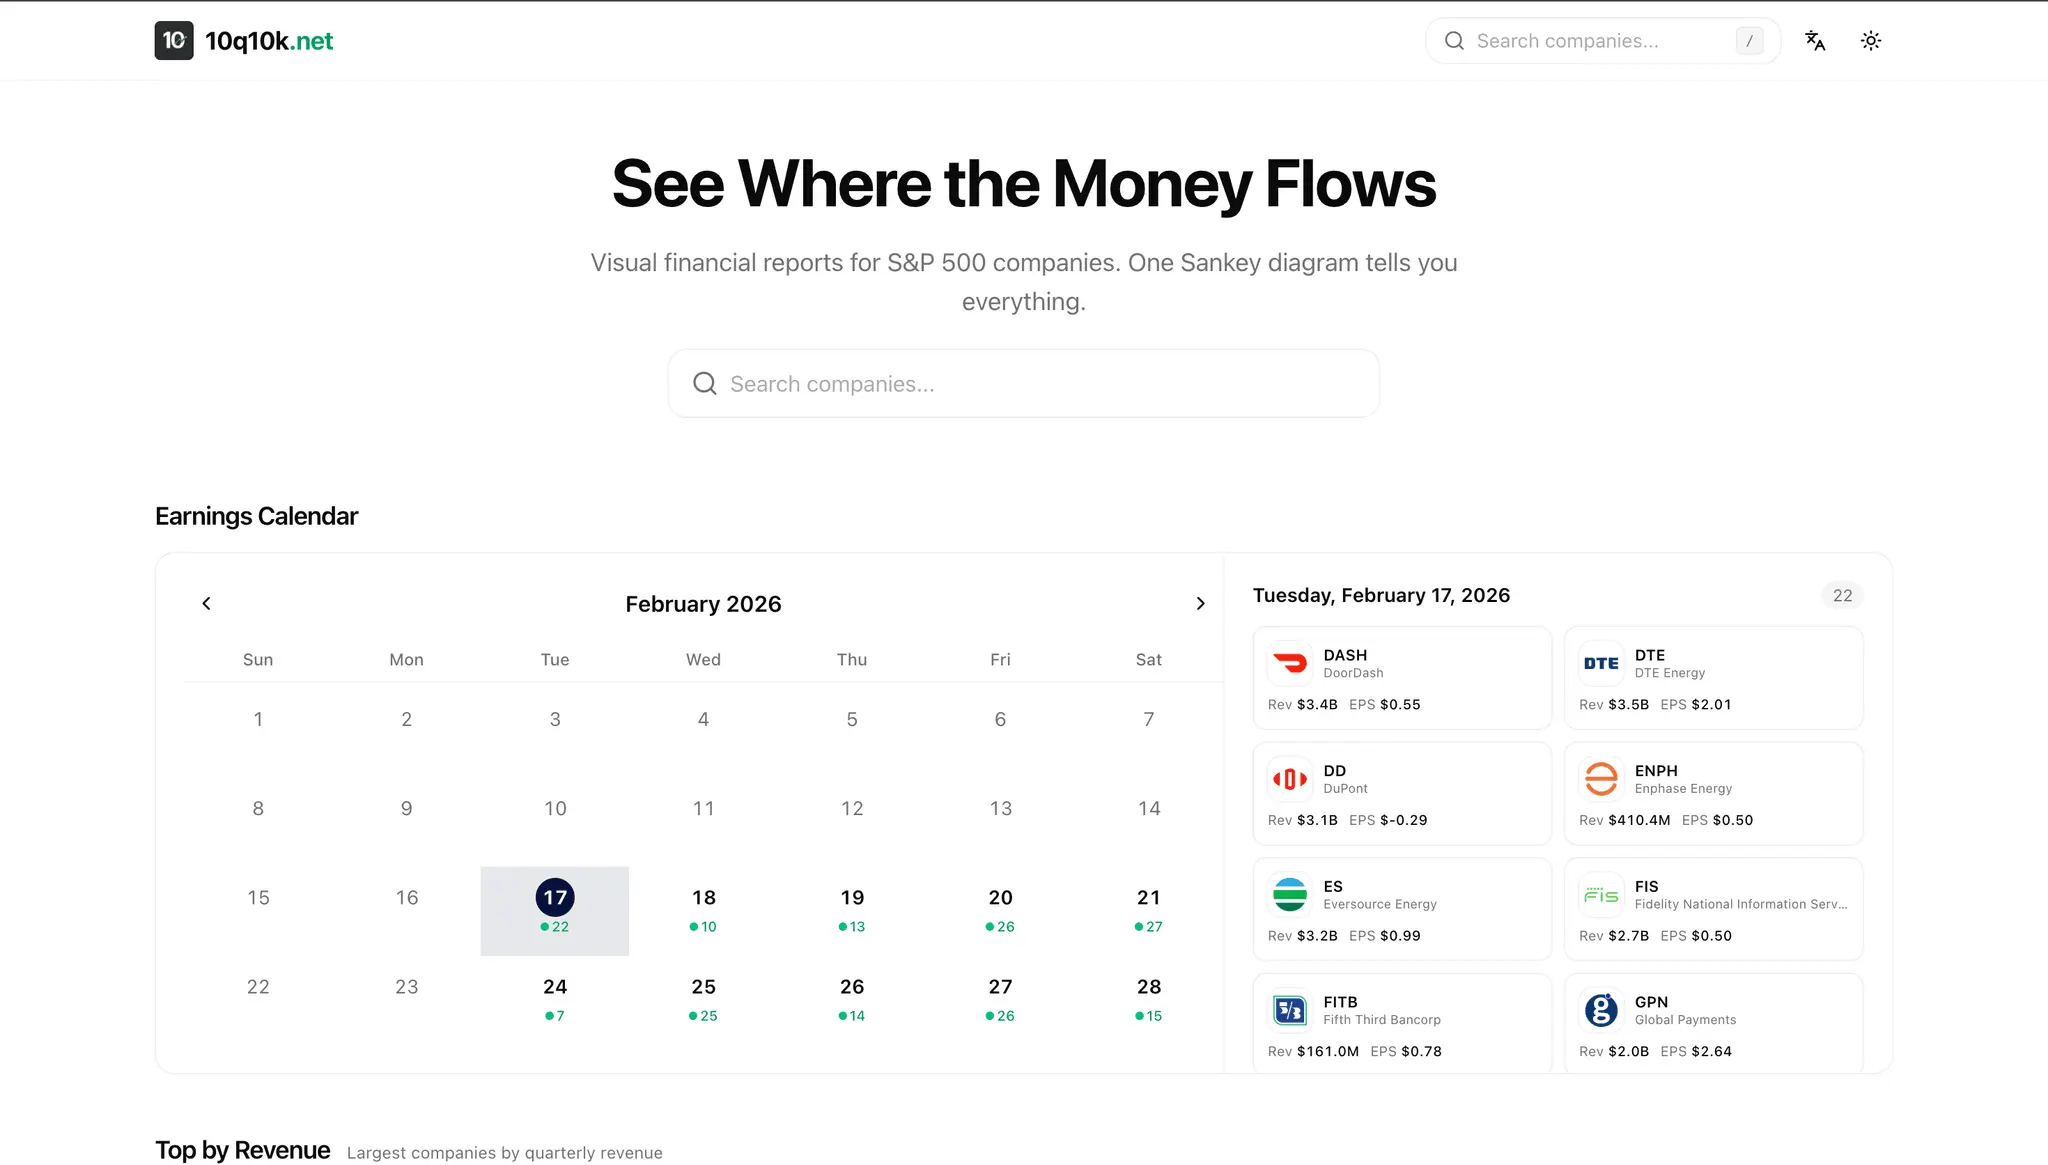
Site offlineVisual financial reports for US stocks
Details
- Target Audience
- Founders & CEOsNon-Technical UsersStartups
- Platforms
- Web
About 10q10k.net
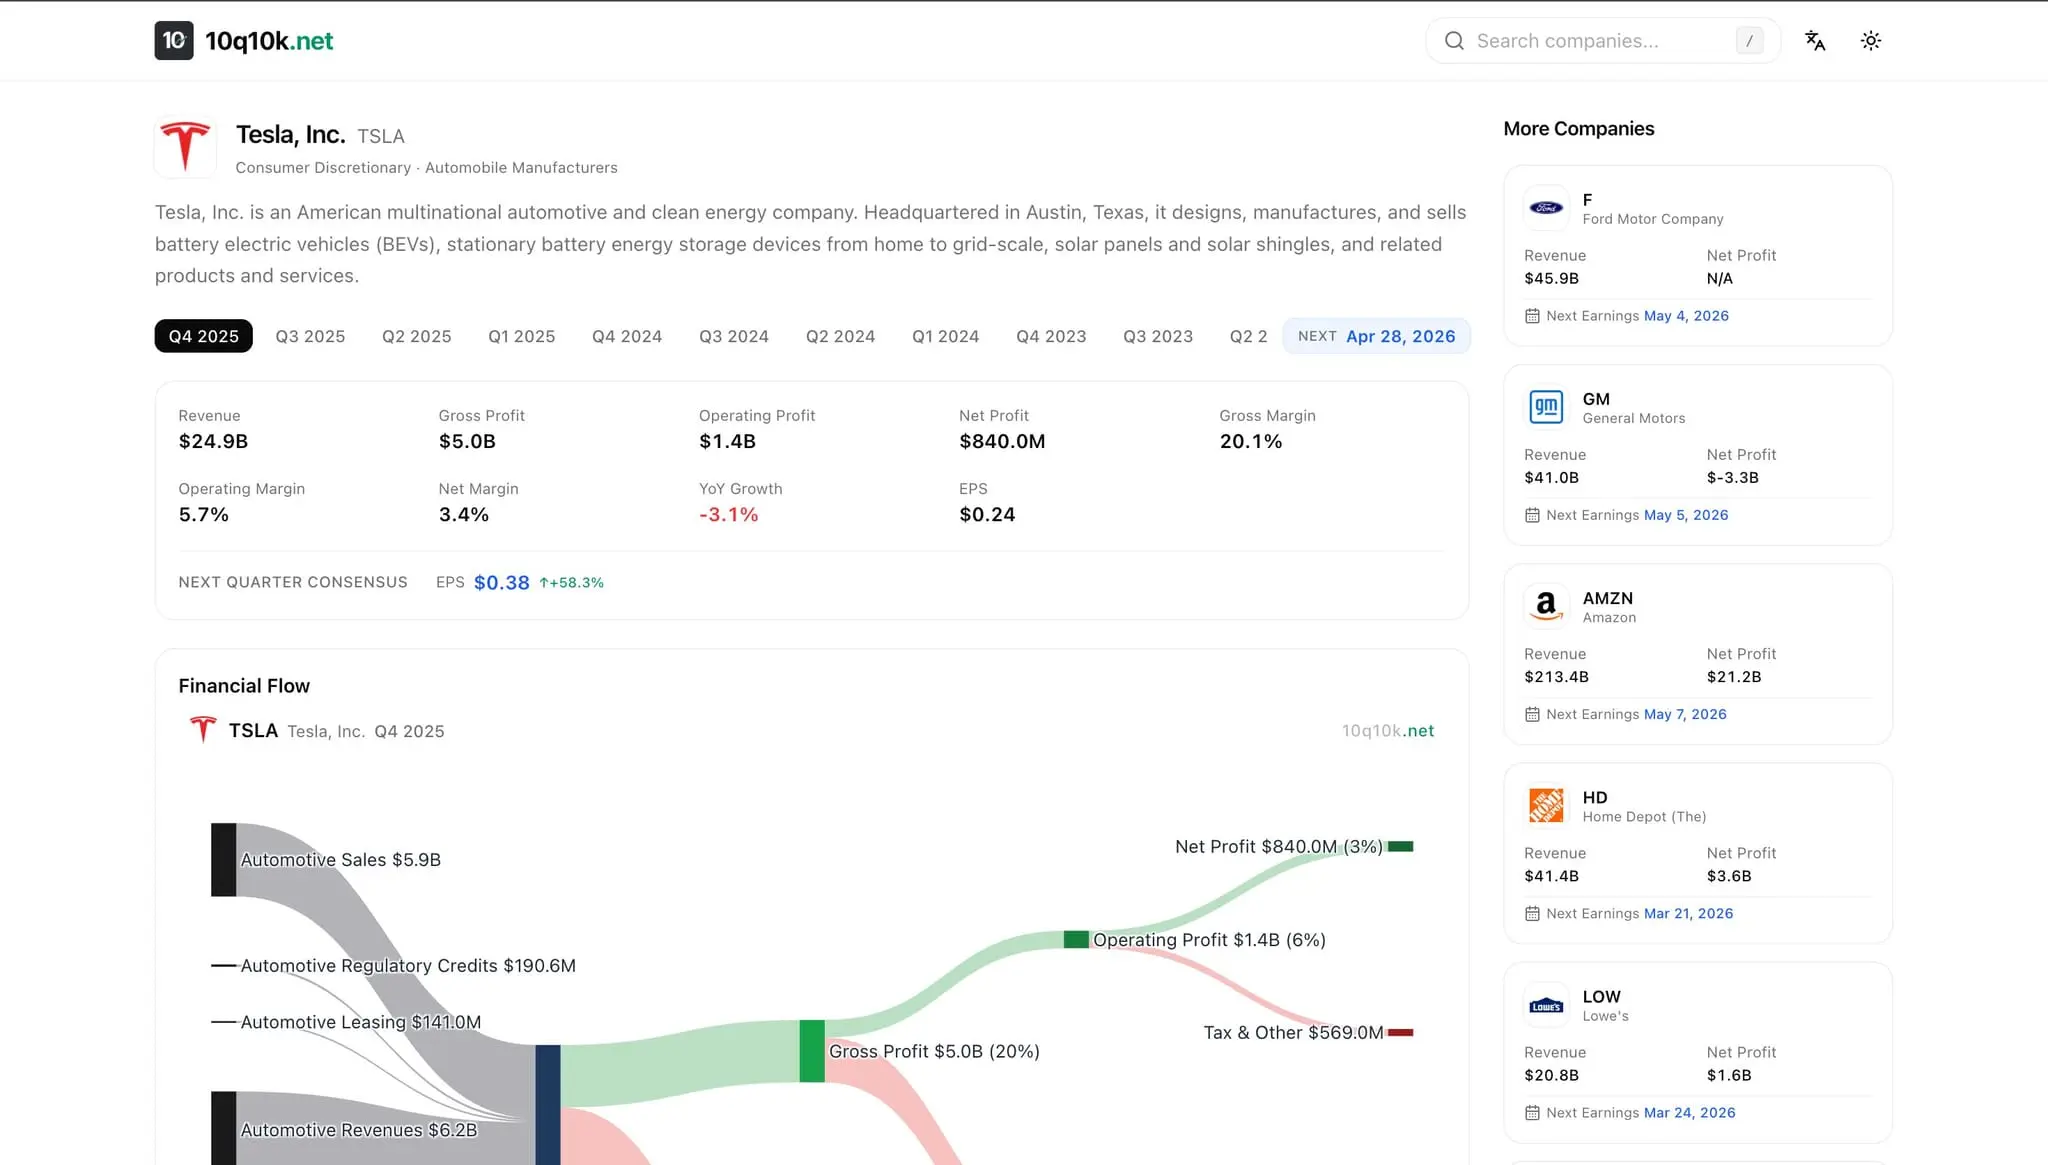
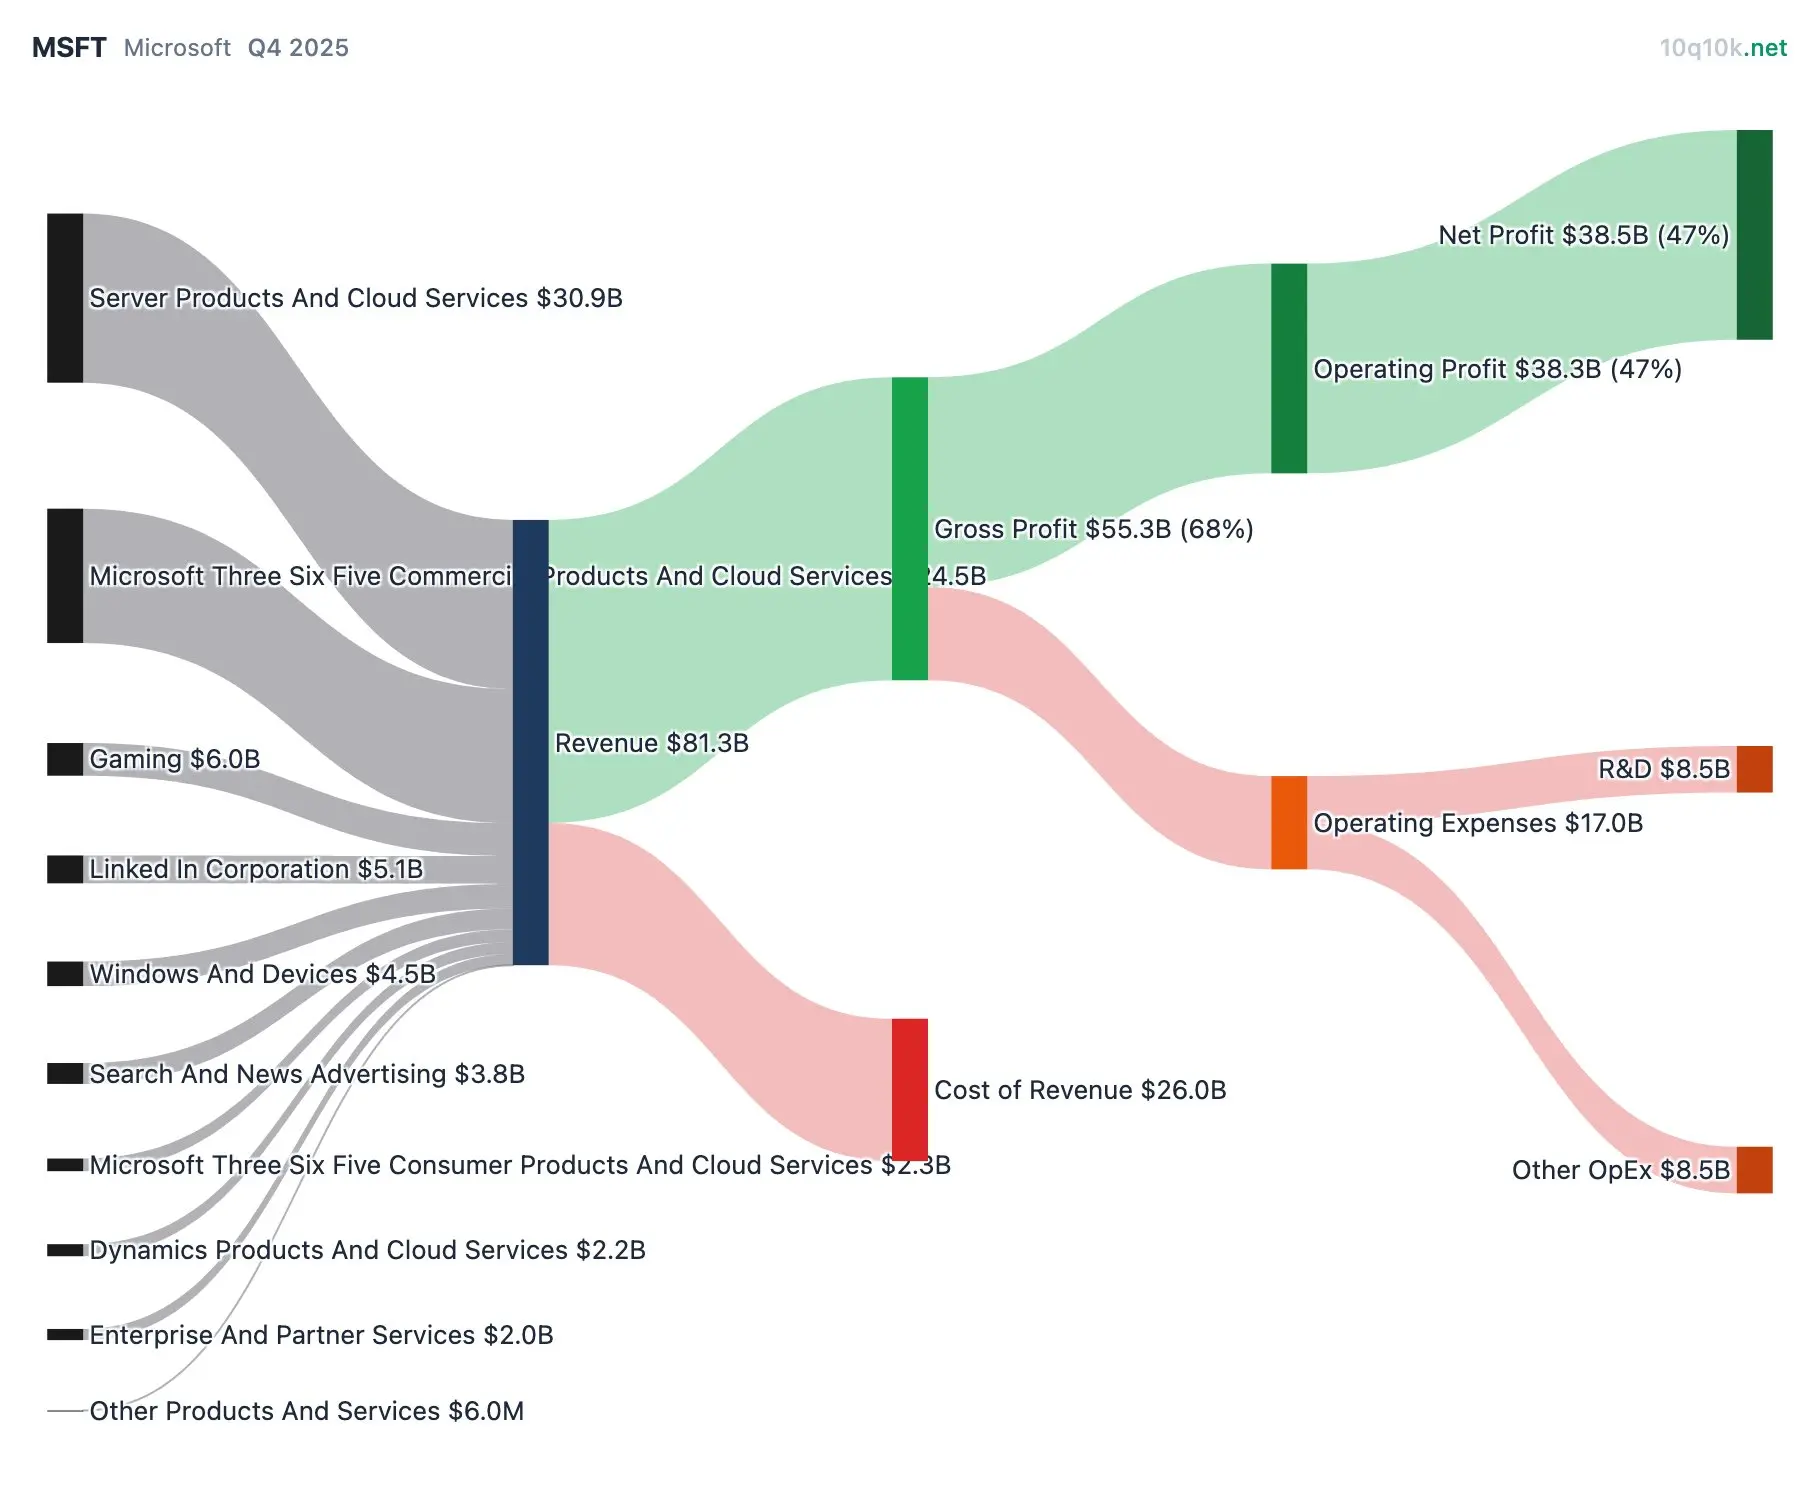
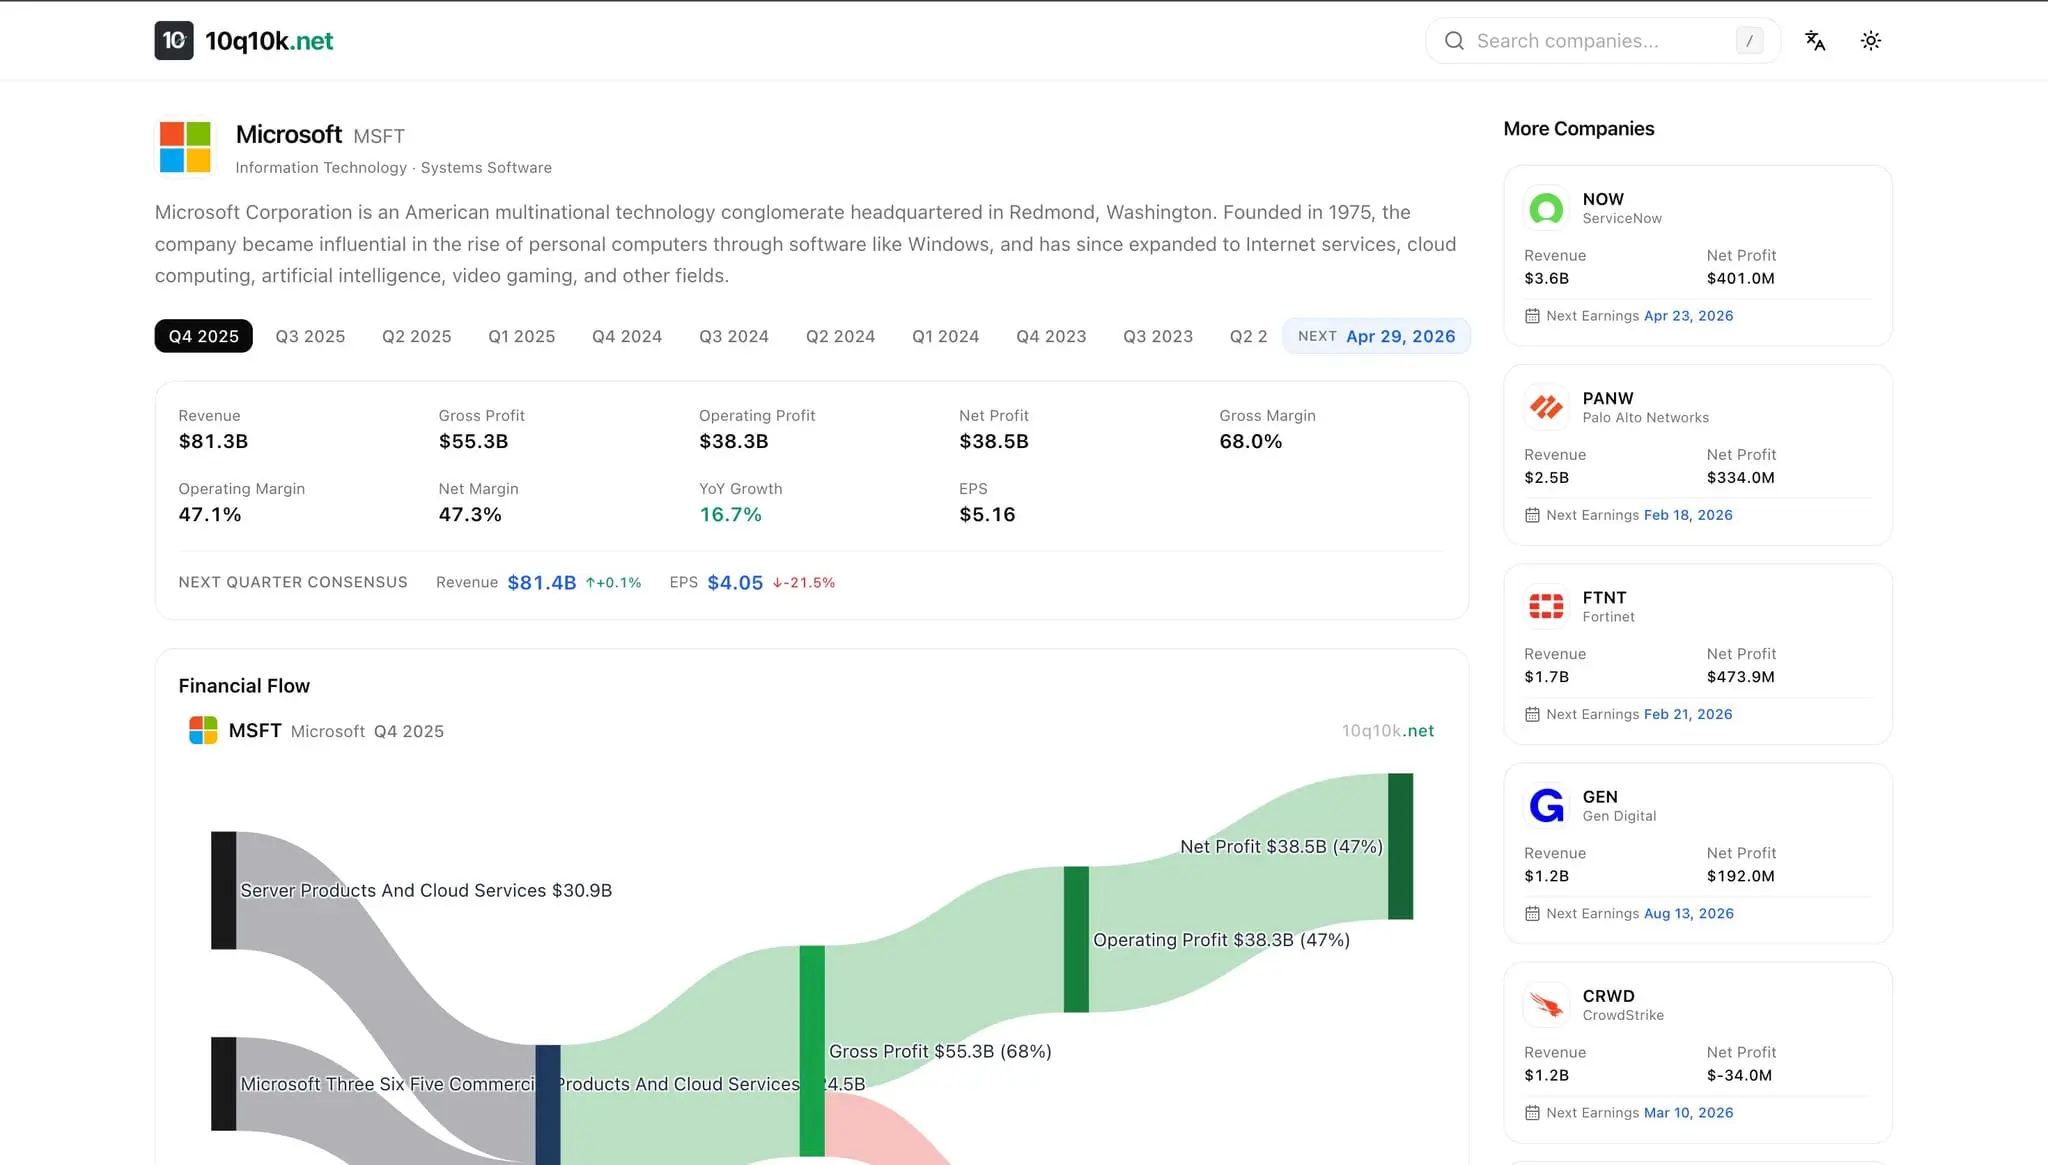
You can transform complex financial data into clear, visual representations. This platform provides visual financial reports for US stocks, allowing you to see exactly where money comes from and where it goes using intuitive Sankey diagrams. It simplifies the analysis of 10-Q and 10-K filings, helping you better understand the revenue and expense structures of publicly traded companies.
Product Insights
10q10k.net is a web-based fintech platform that converts 10-Q and 10-K filings for US stocks into visual financial reports. It specializes in generating Sankey diagrams to map revenue and expense flows for data analysis and competitor research.
- Transforms complex 10-Q and 10-K data into intuitive visual Sankey diagrams.
- Supports multiple use cases including competitor analysis and financial reporting.
- Web-based accessibility for non-technical users to analyze US stock data.
- Specialized focus on revenue and expense structures of publicly traded companies.
Ideal for: Founders, CEOs, and non-technical users can use this platform to simplify the analysis of competitor revenue structures and financial filings.
Screenshots
Reviews (0)
No reviews yet. Be the first to rate this product!
Comments (1)
cool