
Exposure
Stress test your mortgage & portfolio before the market does

Details
- Follow on
- Categories
- Use Cases
- Target Audience
- Platforms
- Featured in
Discovery signals
How AI and people discover Exposure on PeerPush
By AI reads among Fintech tools
12,395 AI reads in the last 30 days, ranked against every Fintech tool listed.About Exposure
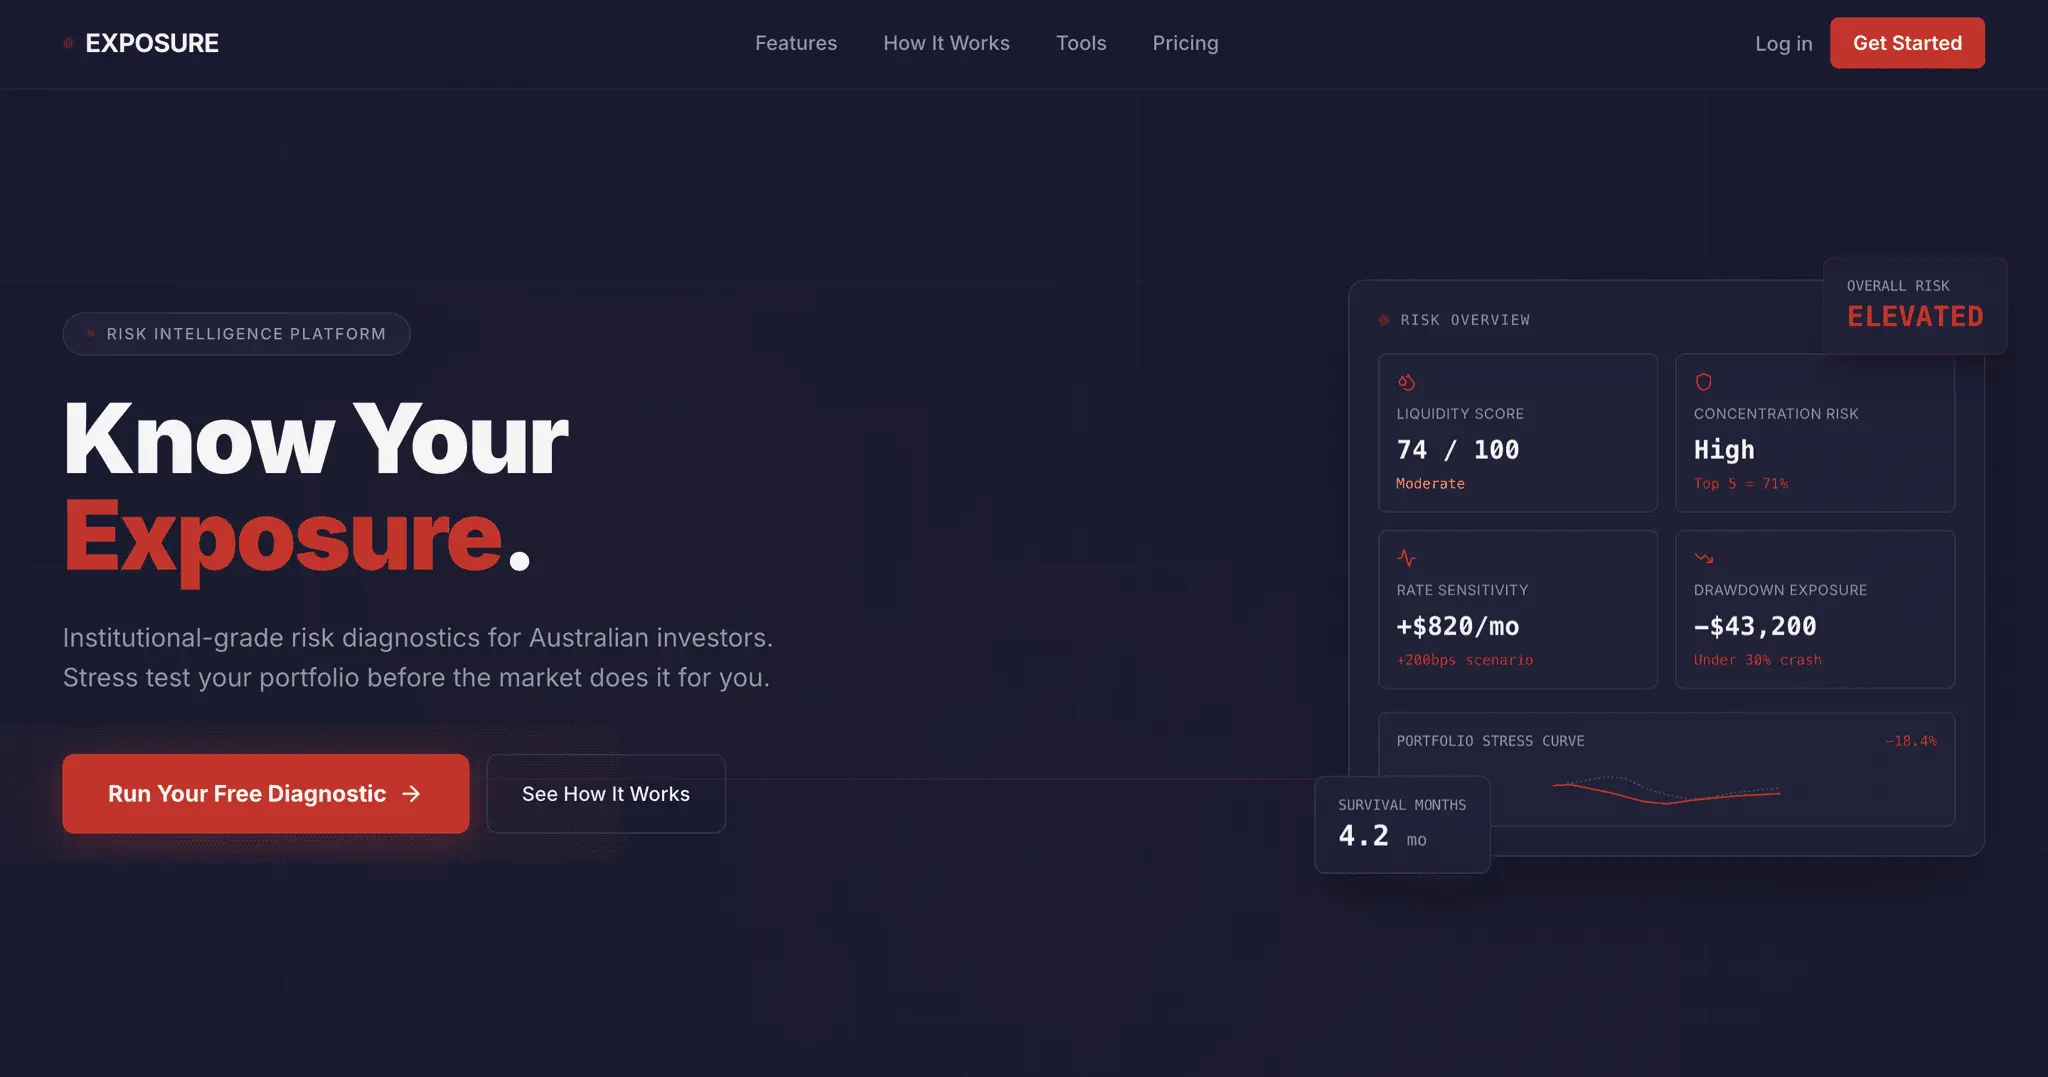
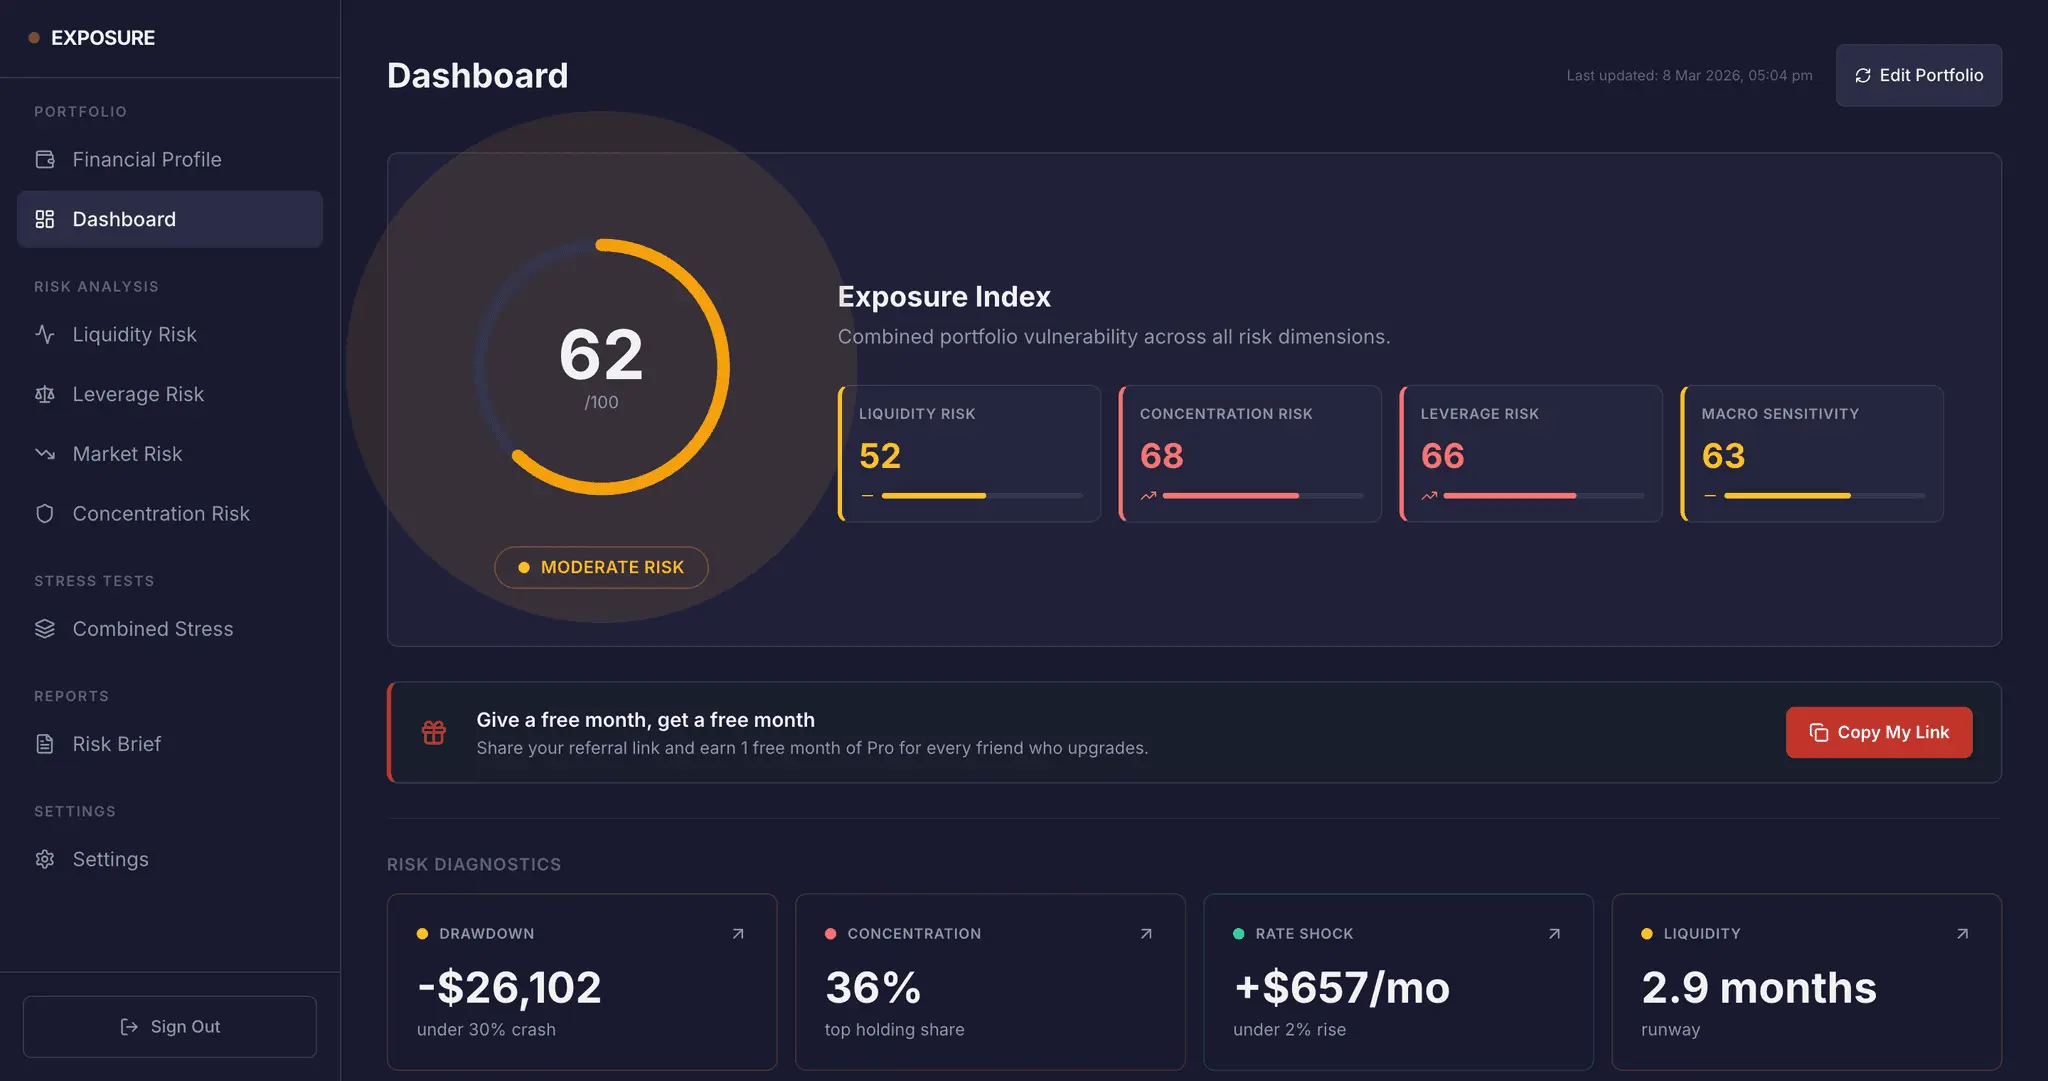
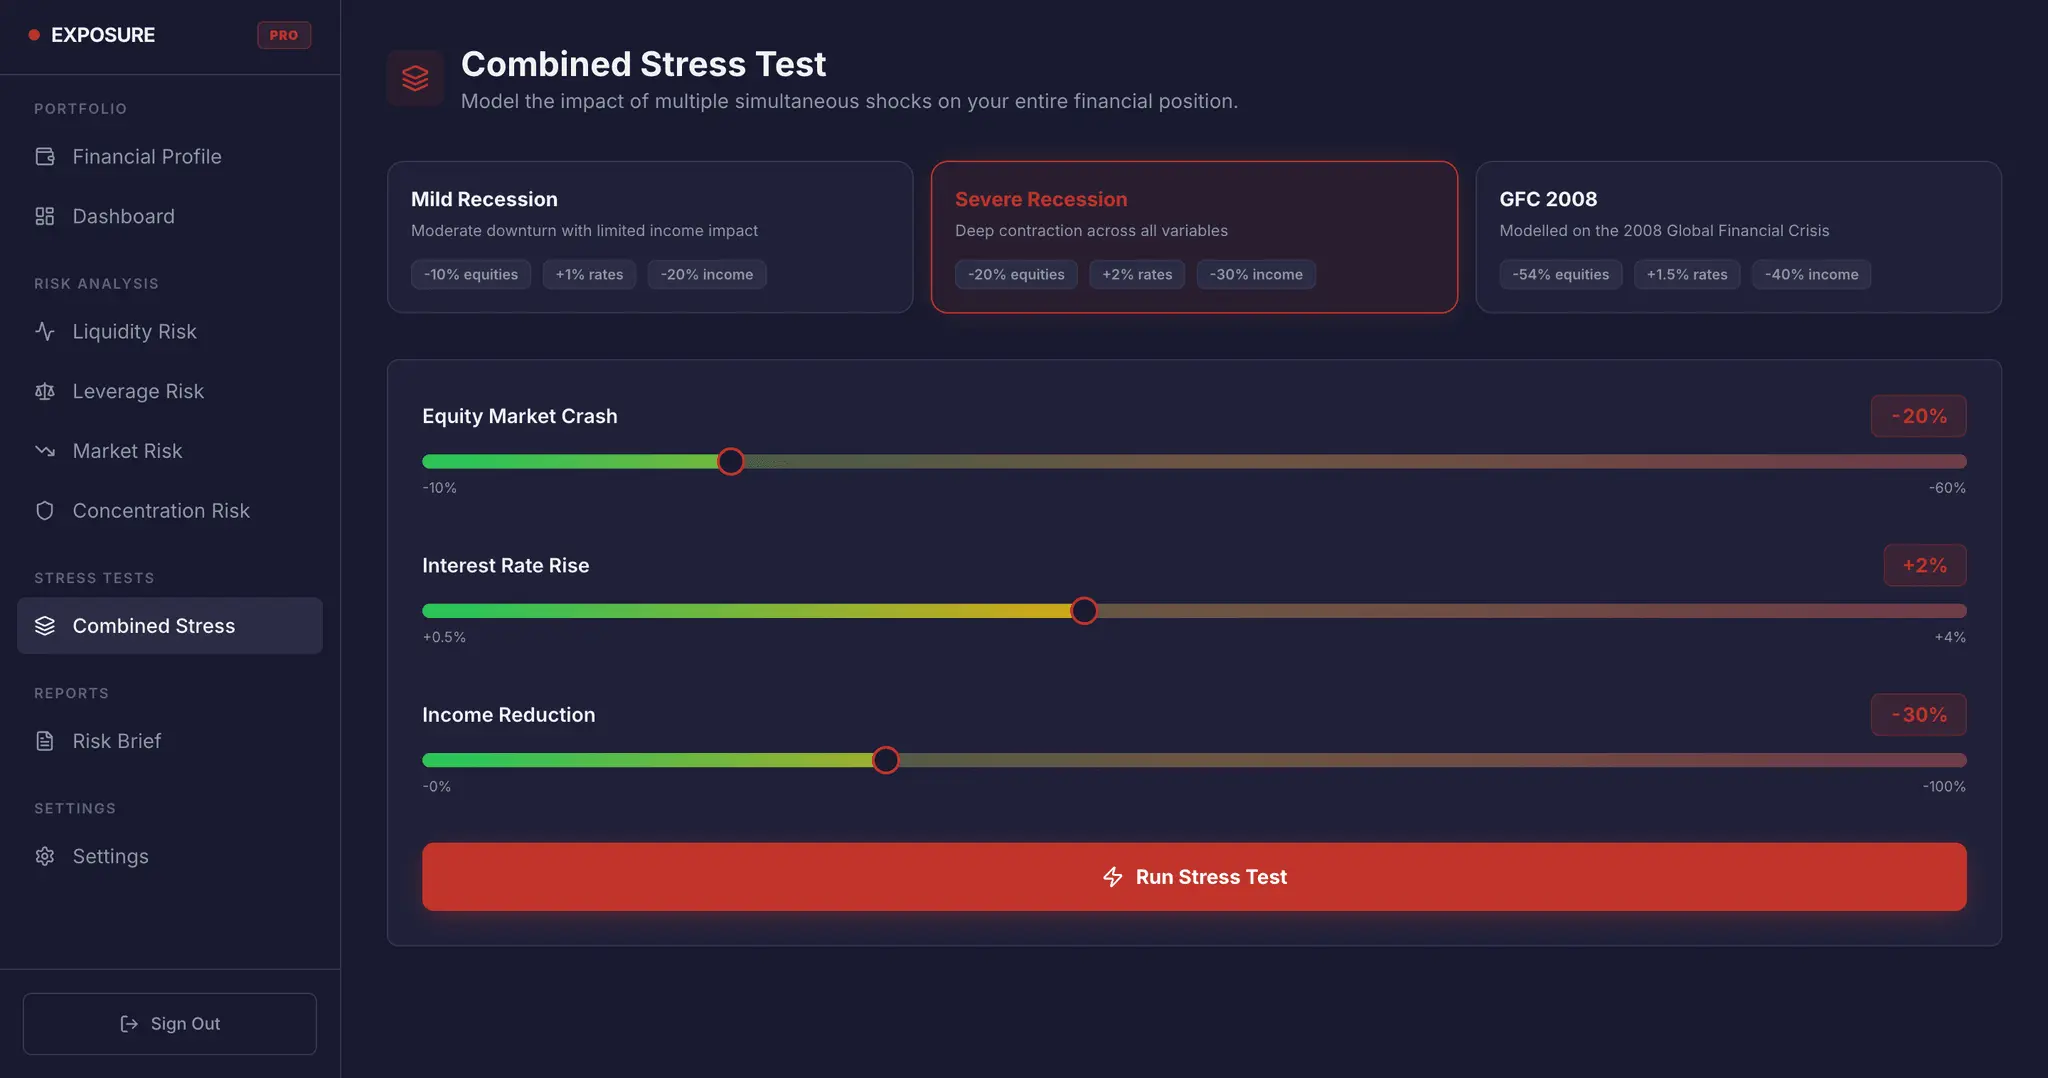
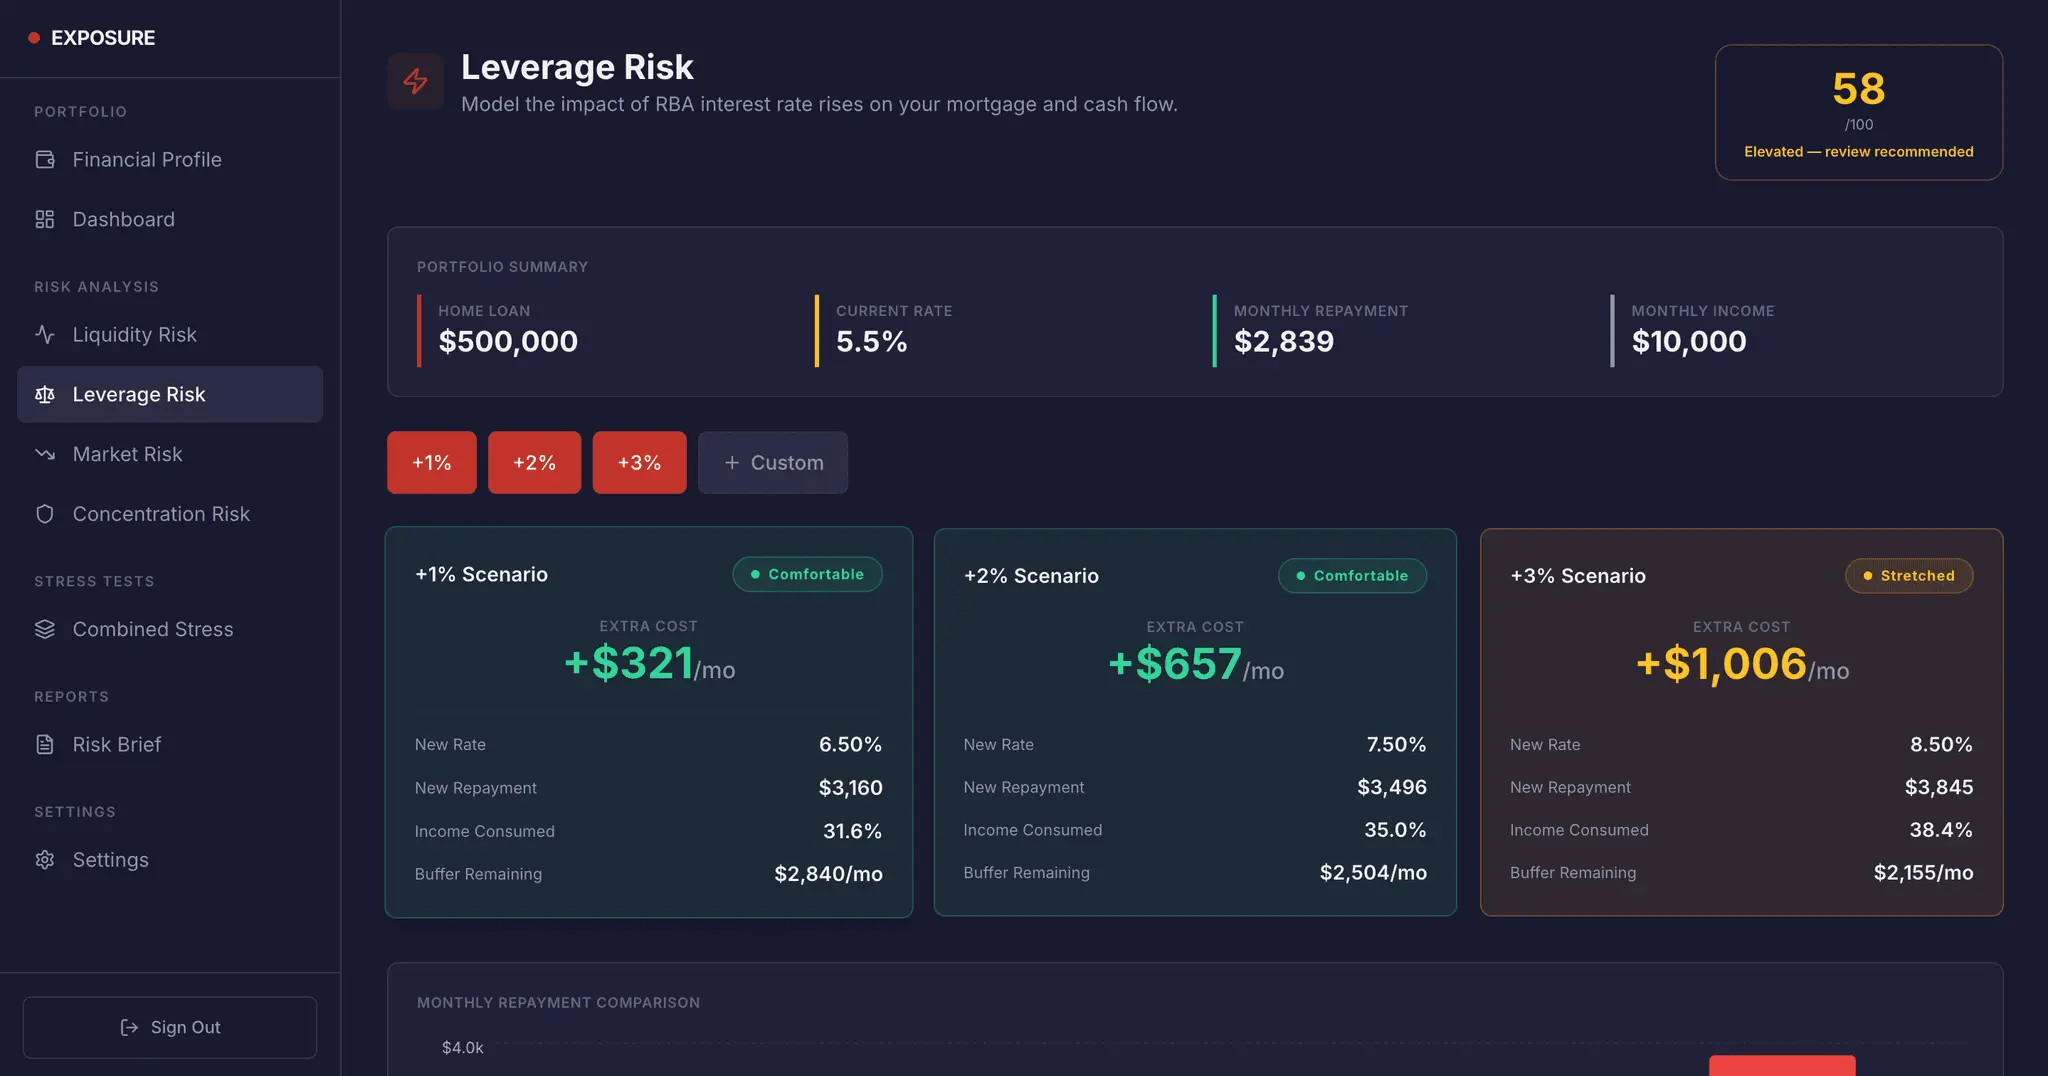
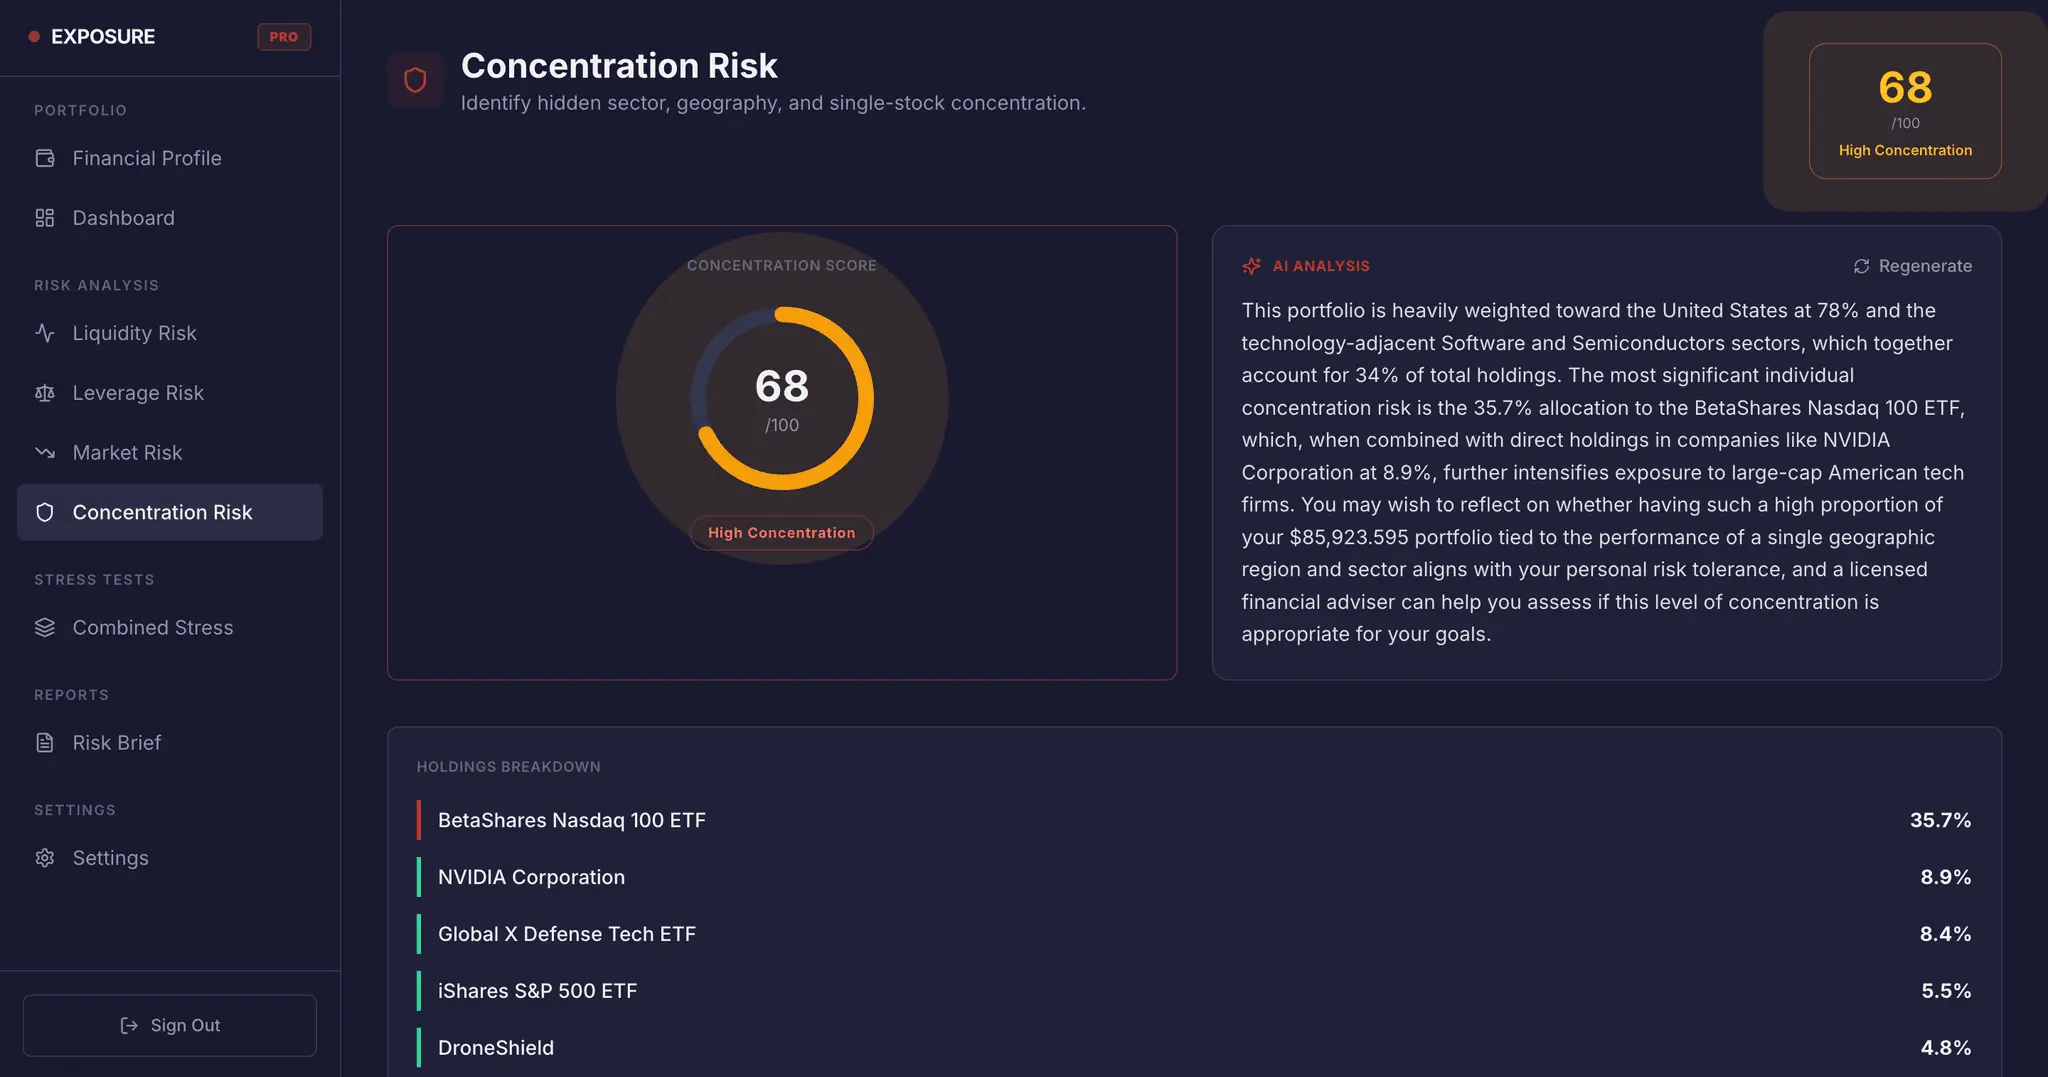
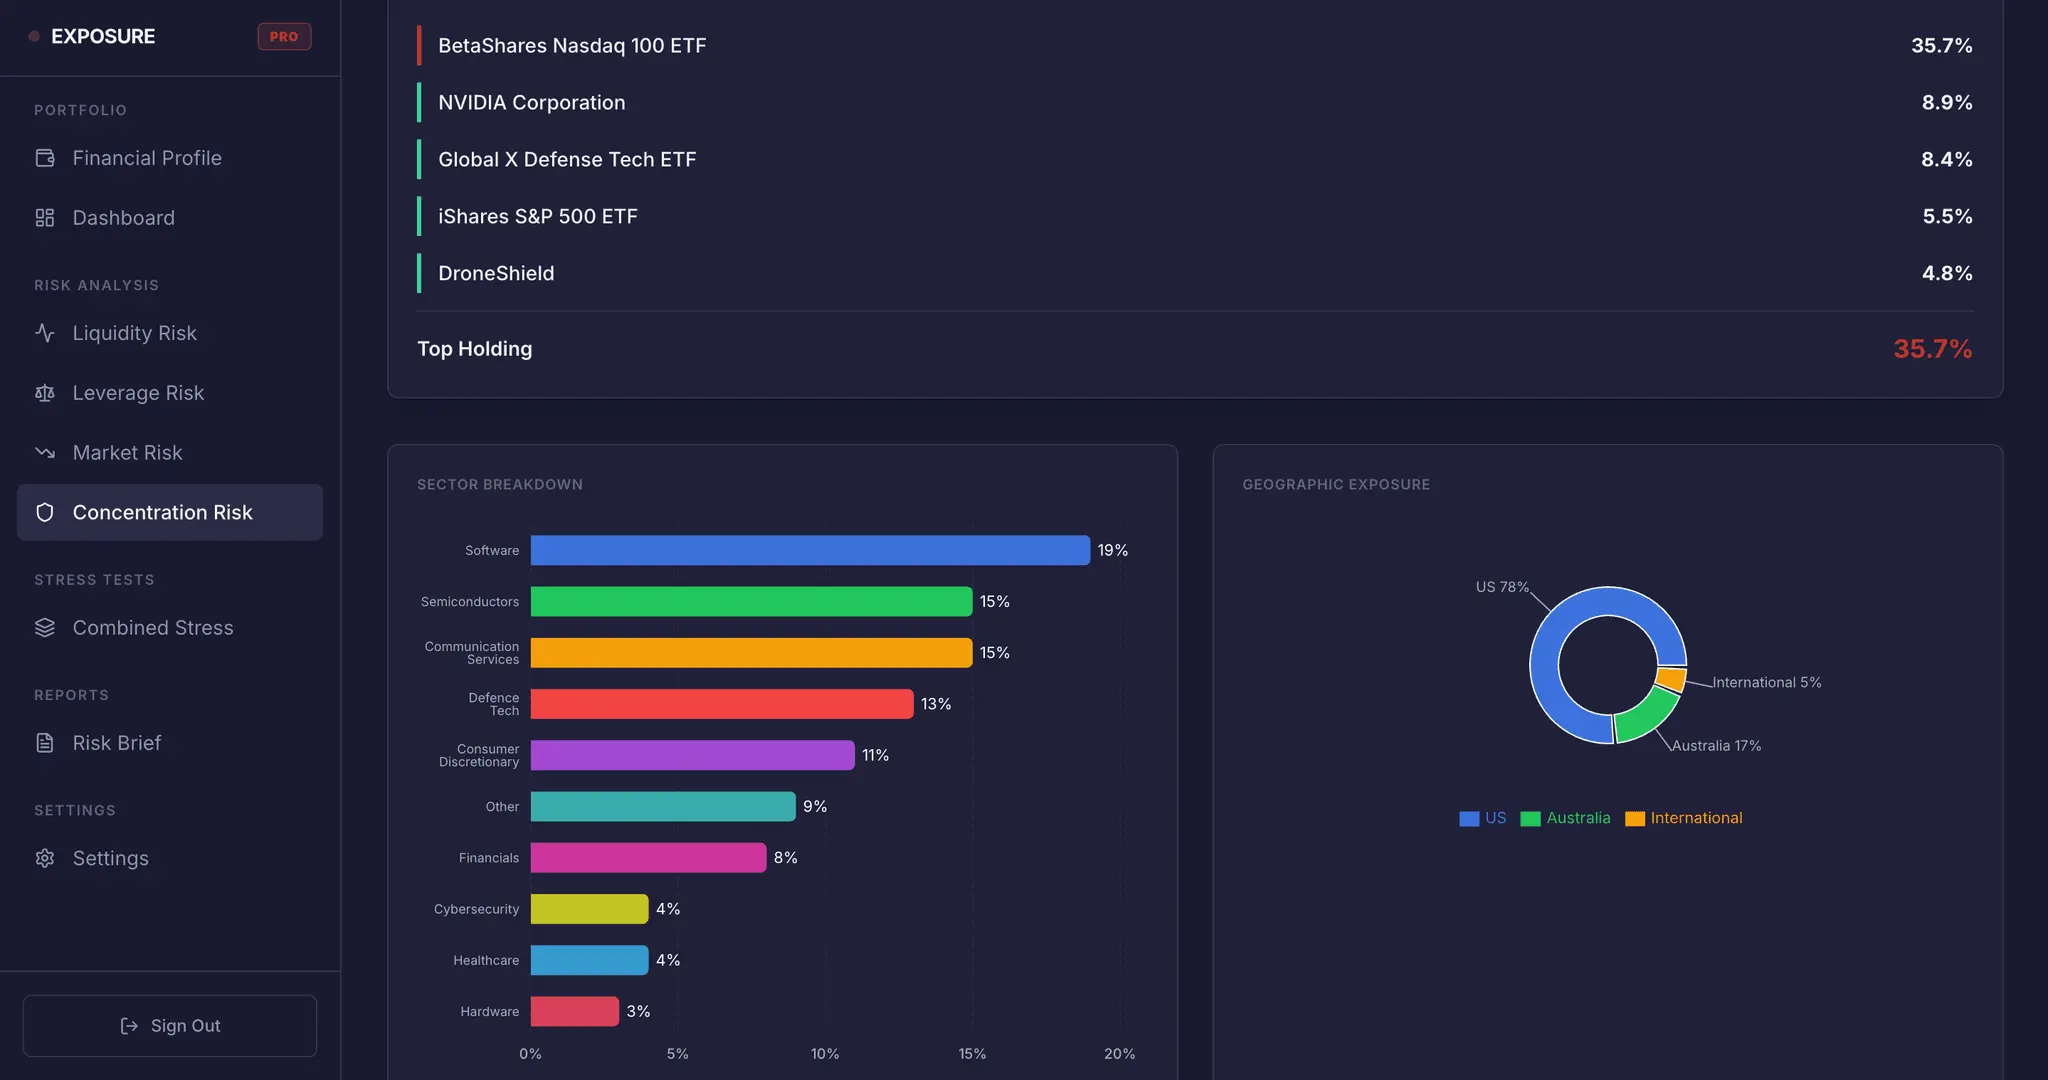
Exposure does two things: stress tests your debt under rate rises up to 3%, and finds the hidden concentration risk inside your investment portfolio. Most investors holding S&P 500, Nasdaq, and other popular ETFs think they're diversified. They're not. NDQ and IVV share over 60% of the same underlying stocks. At the same time, a 1% rate rise costs the average Australian mortgage or debt holder $487 more per month. Exposure stress tests your entire financial picture: repayments under rate rises, portfolio drawdowns under market crashes up to 40%, and the hidden concentration inside your investments. Know your real risk before the market finds out for you.
Product Video
Watch a video demo of Exposure.
Screenshots
Product Updates (1)
Major April Update: Tax Systems, Property Analysis & Portfolio Intelligence
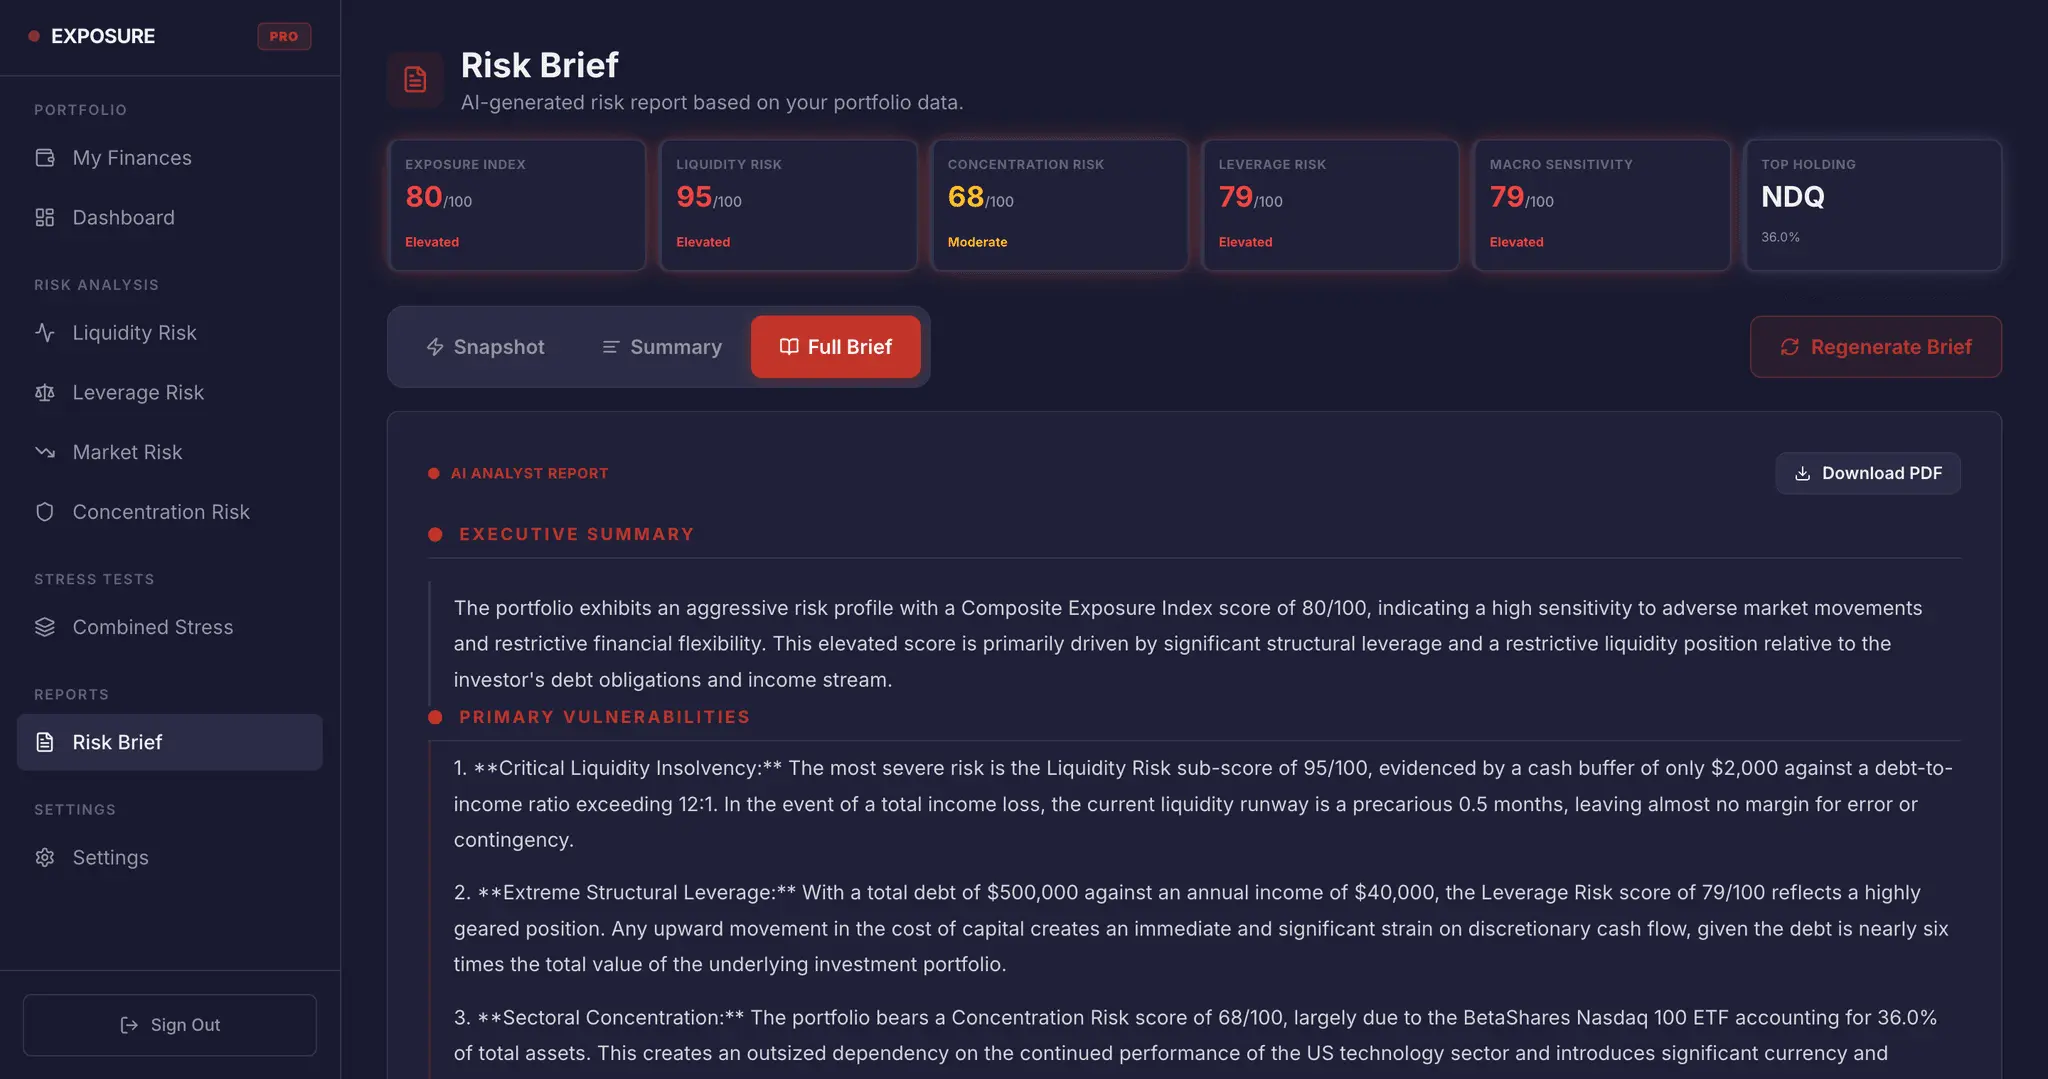
Big update to Exposure this month. Here is what is new: Multi-country tax engine. Full US federal tax bracket calculations with FICA, Medicare, and standard deductions. Australian tax brackets with Medicare levy. Switch between countries and see your after-tax income update instantly. Investment property analysis. Track rental income, mortgage interest deductions, and property expenses. For US users: 27.5-year depreciation calculations, passive loss limitations with MAGI phaseout rules, and an editable land value percentage. For Australian users: full negative gearing support flowing into your tax estimate. Mortgage stress testing across multiple properties. If you have two mortgages, the stress test now models rate rises on both simultaneously. Dynamic breaking point calculation shows exactly when your cash flow turns negative, with a "What if you cut spending" tool showing how expense reductions shift your breaking point. True portfolio exposure. See through your ETFs to the actual stocks you own. If you hold NDQ and IVV, we show your real NVDA exposure is 11.8% not just the 8.4% you entered. Hidden overlap detection across all your funds with full sector breakdown. Margin loan and offset account support on the debts and assets tabs. HECS-HELP integration. Enter your balance and we automatically calculate your mandatory repayment based on ATO brackets, flowing it into all cash flow and stress test calculations. Plus: dividend income projections, display currency conversion across 10 currencies, CSV/PDF portfolio import, and an AI-generated Risk Brief you can download as a PDF. More coming soon. Would love feedback on what you want to see next.
Comments (1)

Reviews (0)
No reviews yet. Be the first to rate this product!
Comments (12)
Congrats
Happy Launch
Good idea
Nice and practical idea.
How long did it take you to build=?
@info748 I'd say 2-3 weeks.
This is an interesting Fintech idea. I like that we're in a similar space.
Very smart idea. Keep them coming!
It was a good lunch day with you guys, great idea as an investor!
@guidofrigieri appreciate it!
Really smart idea. Most people have no clue how much ETF overlap they actually have. The stress testing angle is a great hook — would love to see a "what if" simulator for different rate scenarios.
@swinchercreative thanks, good idea!
Can live crypto holdings be added and tracked live like stocks?
@jakemorris94 yes later this week.