
GU Analyser
No-code backtesting for US stocks and ETFs
Details
- Target Audience
- Pricing
- Freemium from $13.99
- Platforms
Discovery signals
How AI and people discover GU Analyser on PeerPush
About GU Analyser
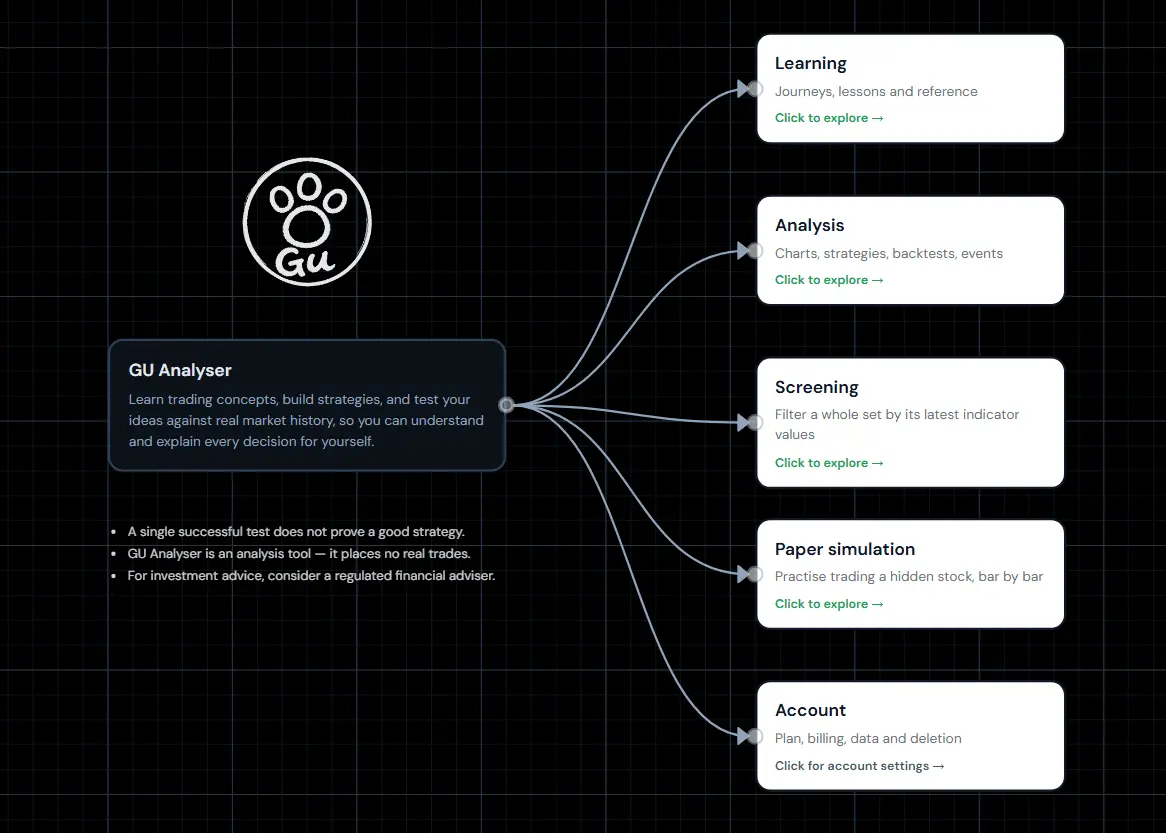
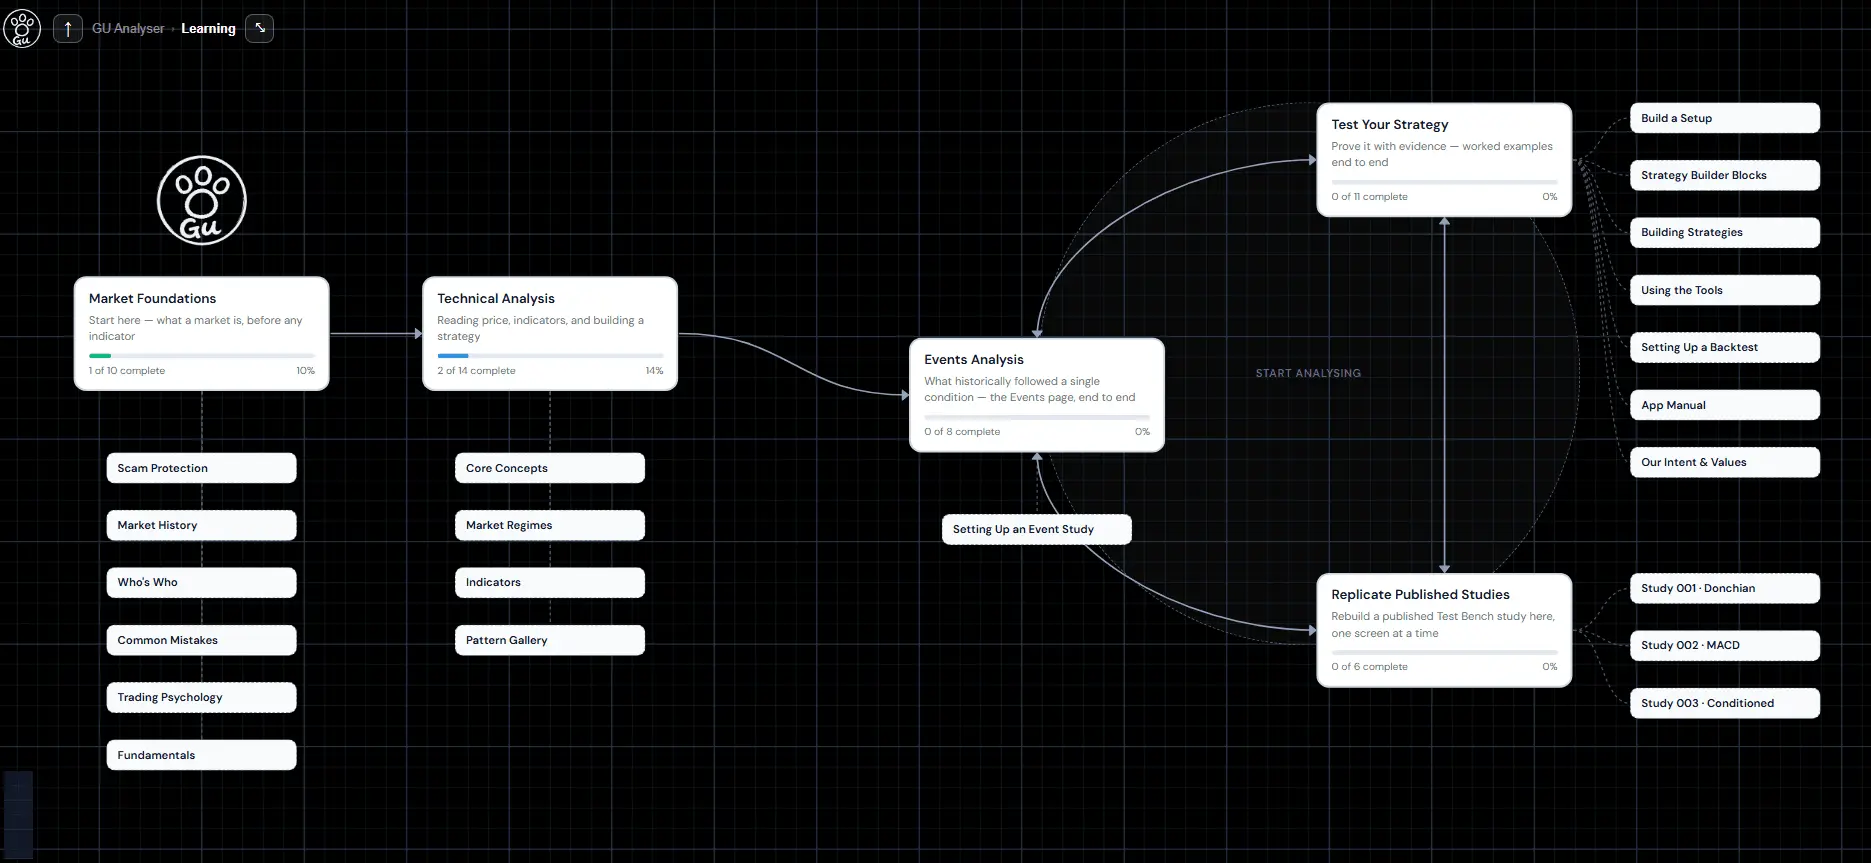
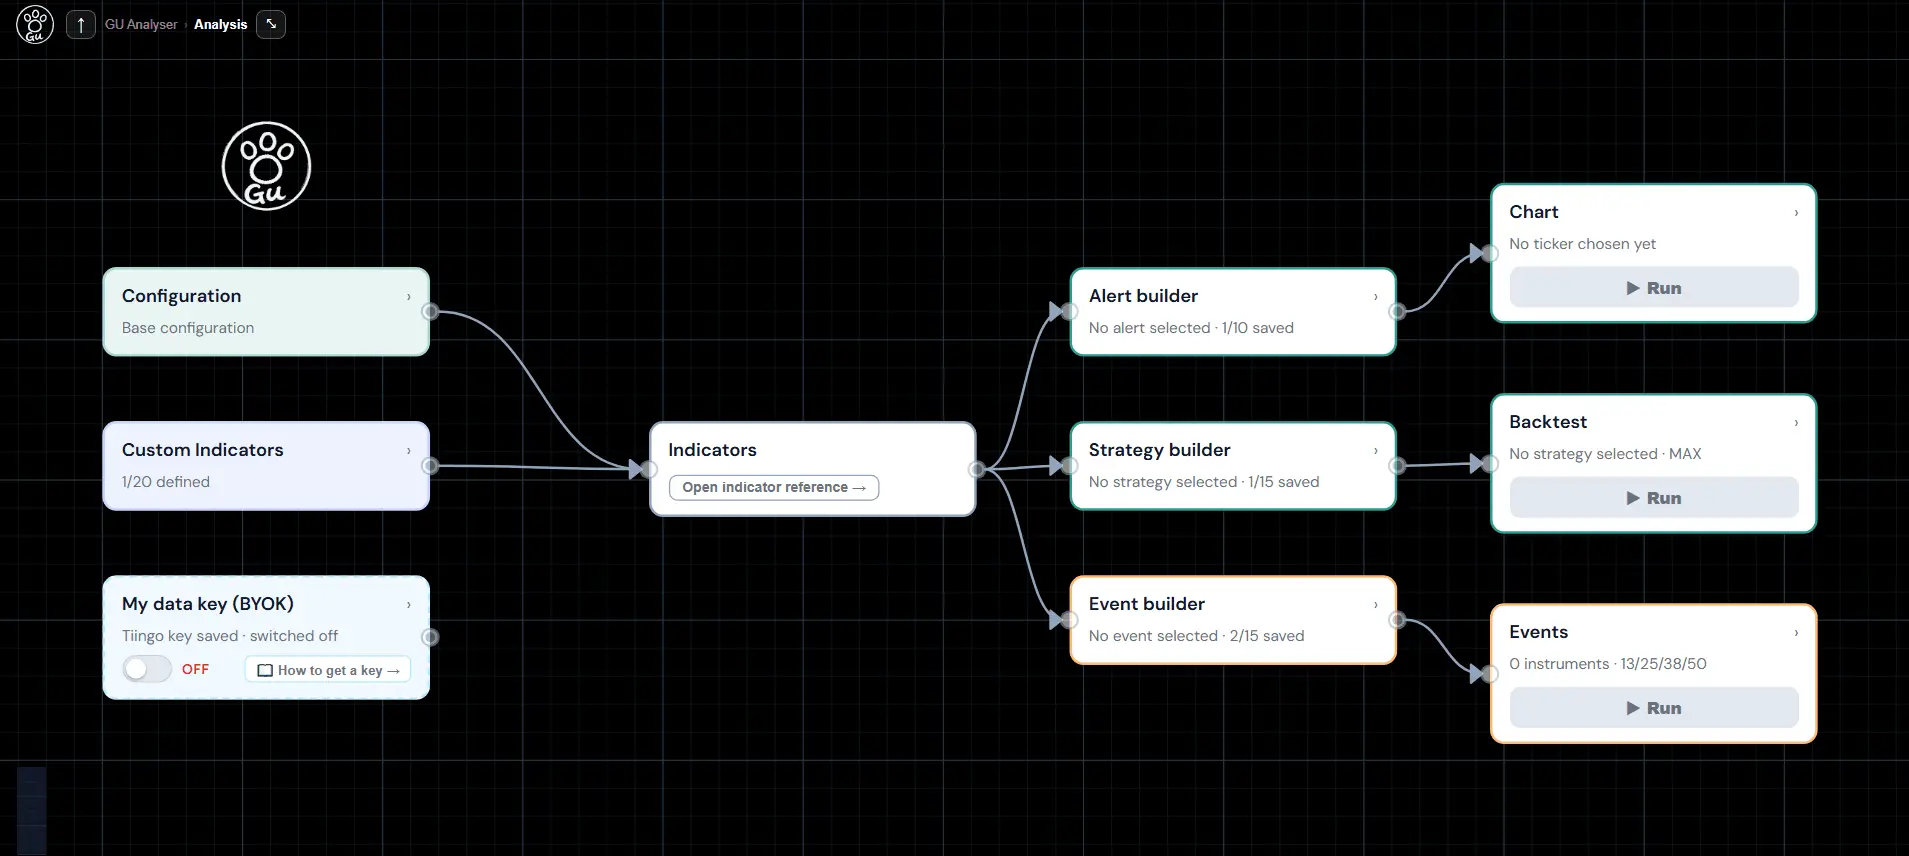
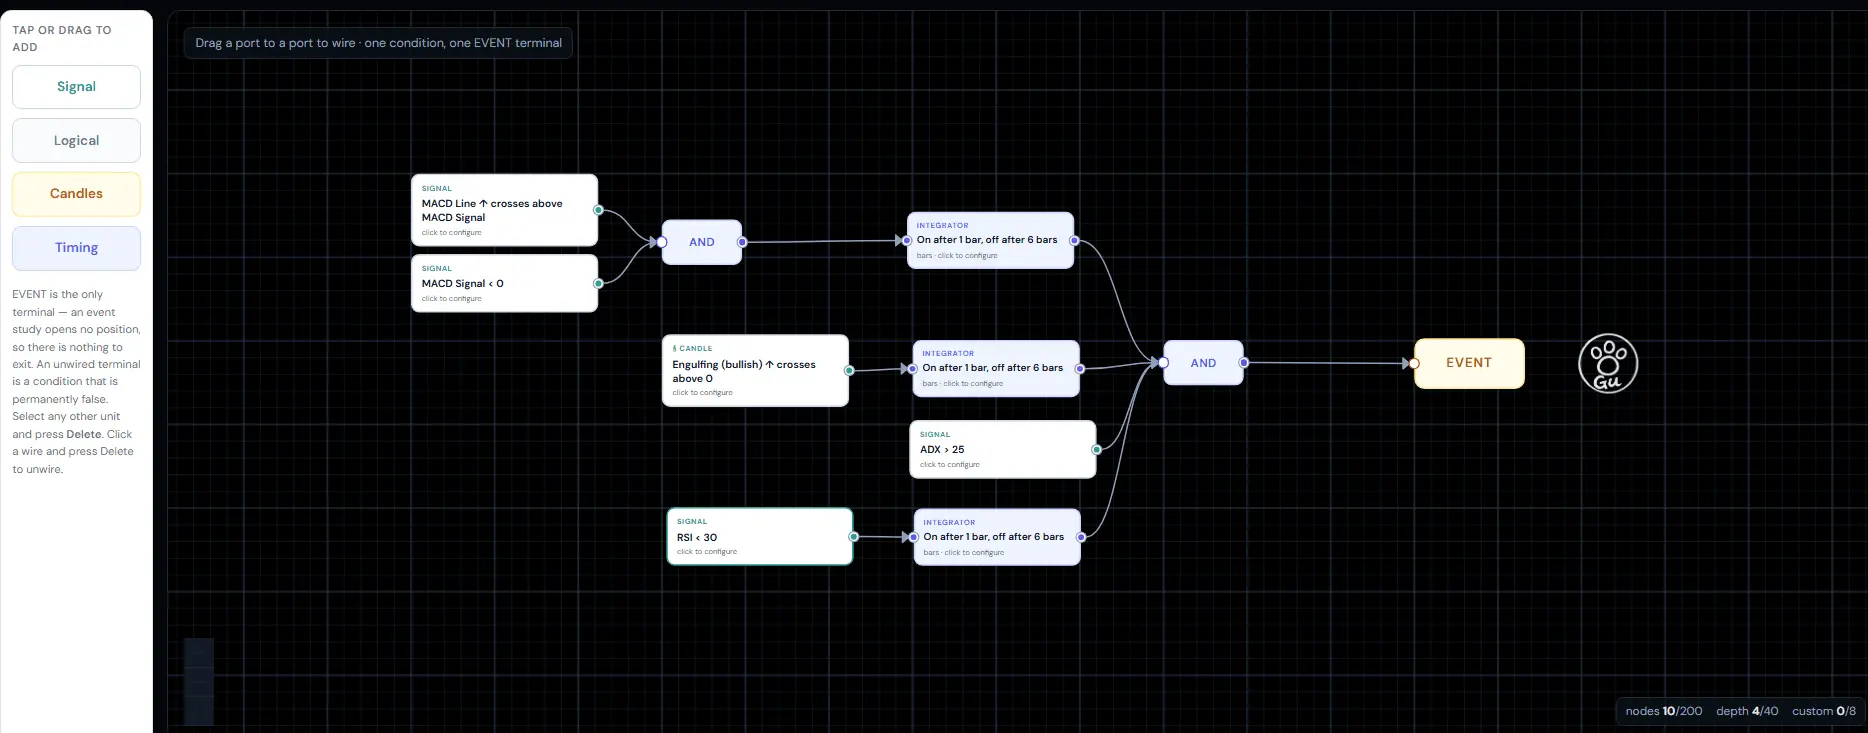
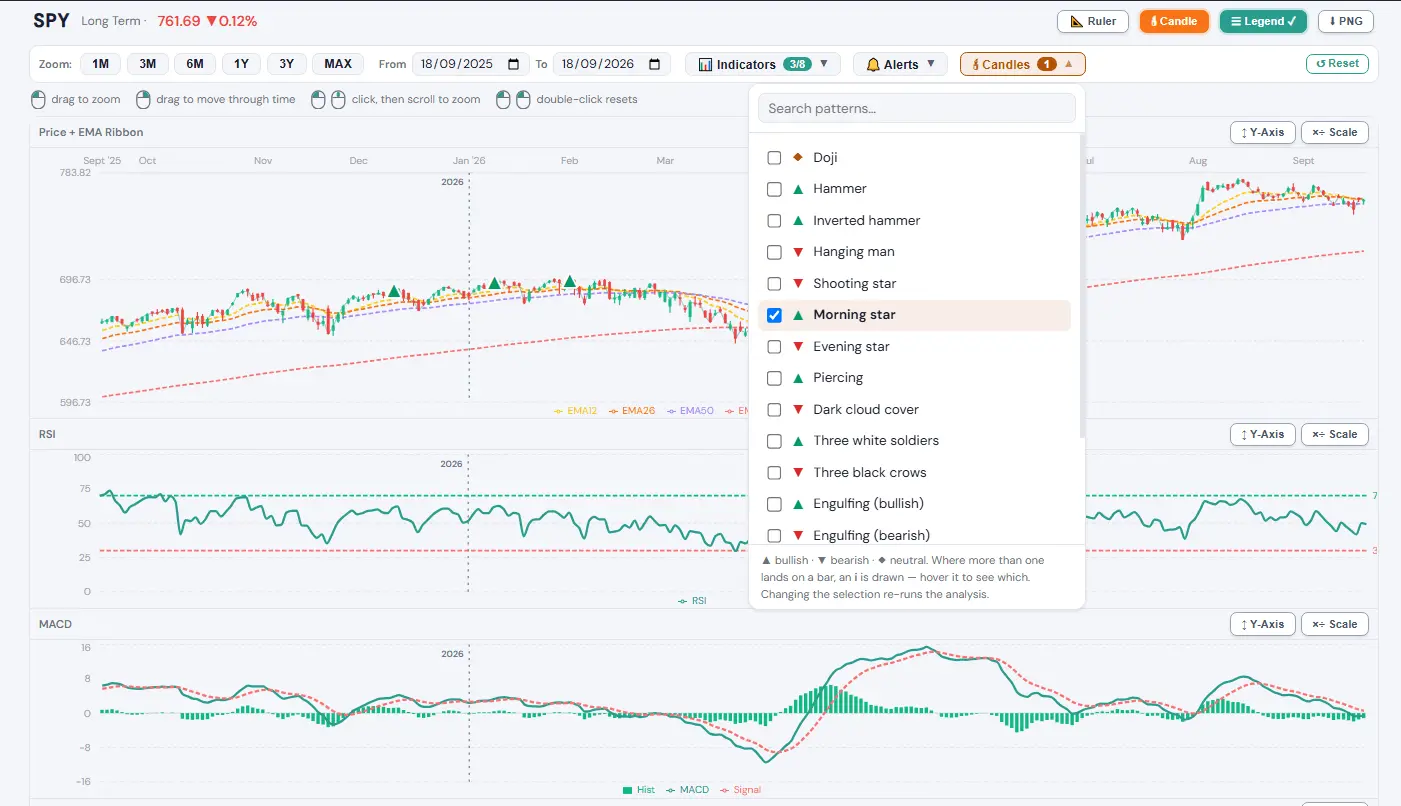
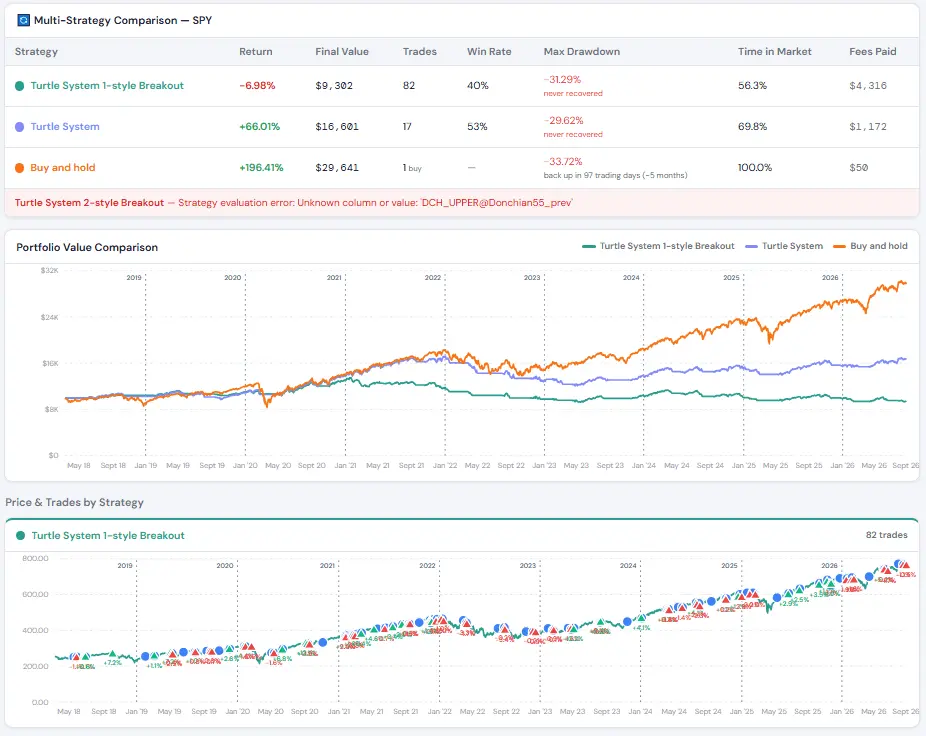
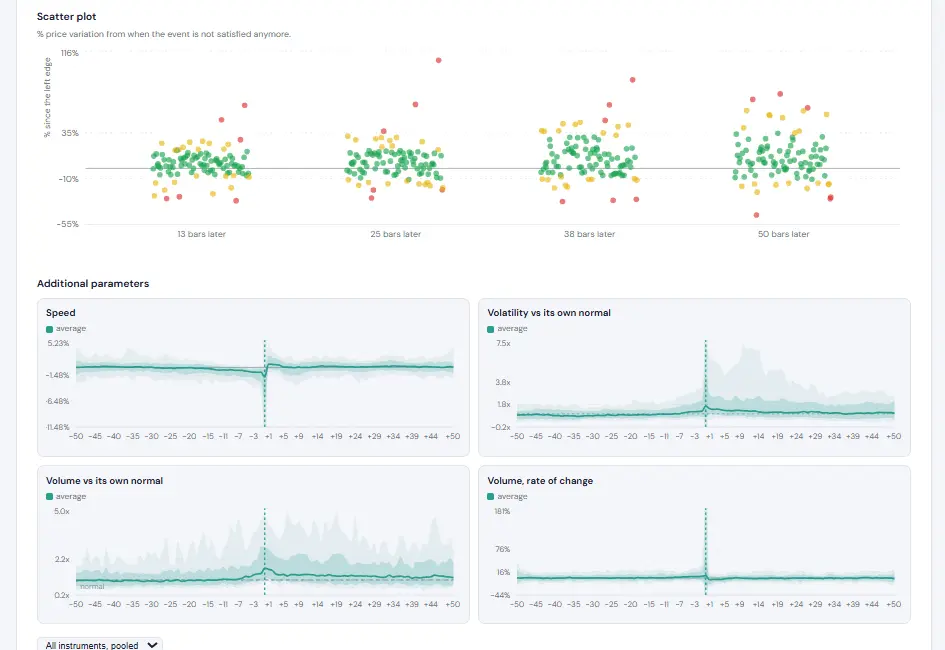
**GU Analyser** is a fully visual, no-code trading analysis and backtesting platform for traders who want to explore market behaviour, analyse events, build trading strategies, and test ideas without writing code. The platform combines **interactive charting, technical indicators, visual event analysis, strategy building, and historical backtesting** in one environment. Users can move from a visual observation on a chart to a defined trading condition, analyse how that condition has behaved historically, build a strategy around it, and backtest the resulting rules. ### Visual Event Analyser A key feature of GU Analyser is the **Event Analyser**, which provides a visual way to investigate what happens before and after specific market events or conditions. Users can define events using candlestick patterns, technical indicators, and other conditions, then examine their historical occurrences directly on the chart. This makes it possible to investigate questions such as: * What happens after a particular candlestick pattern? * How does price behave when an indicator reaches a specific condition? * What happens when multiple technical conditions occur together? * How frequently does an event occur? * What does subsequent price action look like after the event? Because the analysis is visual, traders can explore these questions directly from the chart rather than having to write code or build a separate data-analysis workflow. The Event Analyser can also form the starting point for strategy development: an interesting market event can be identified, analysed historically, refined with additional conditions, and then incorporated into a backtestable trading strategy. ### Visual Strategy Builder & Backtesting GU Analyser allows users to construct trading strategies visually by combining **candlestick patterns, technical indicators, conditions, entries, exits, and timing rules**. Automatic candle detection can identify formations as they occur. Built-in **latching and confirmation timers** allow users to specify how conditions should persist or be confirmed before an entry or exit is triggered, helping create precise and repeatable trading rules. Once a strategy has been constructed, users can **backtest it against historical market data**. Backtesting allows traders to examine how their rules would have behaved over historical periods, investigate individual trades and signals, and refine their strategy based on the results. The workflow is designed to be iterative: **Observe → Analyse an Event → Build Rules → Backtest → Refine** This makes it possible to move from an initial trading hypothesis to a structured, testable strategy without programming. ### Interactive Market Analysis GU Analyser provides interactive charts and technical indicators for hundreds of US stocks, ETFs, and major indices, with support for more than **14,000 tickers through a personal data key**. Users can combine price action, candlestick patterns, and indicators to investigate market behaviour in detail. The platform can be used for exploratory analysis even when a user does not intend to build a complete trading strategy. ### Screener & Simulation A built-in screener allows users to filter instruments according to selected criteria, helping them identify markets that meet particular conditions. The simulation mode provides another way to explore strategies by running them against randomly selected stocks. This allows users to investigate how an idea behaves across different instruments and market environments without manually configuring every test. ### Built for No-Code Trading Research GU Analyser is designed for both traders who are new to systematic analysis and experienced users who want a visual environment for developing and testing trading ideas. A dedicated learning section introduces the platform's concepts and tools, while more advanced users can construct detailed event conditions, strategy rules, confirmation logic, and historical backtests. The result is a **visual, code-free workflow for market research and strategy development** — from analysing a market event and studying its historical behaviour to building, backtesting, and refining a complete trading strategy. **Key features:** * Visual, no-code trading analysis * Event Analyser for investigating historical market events * Interactive charts and technical indicators * Candlestick pattern detection * Visual strategy builder * Historical strategy backtesting * Entry, exit, latching, and confirmation logic * Stock and ETF screening * Randomised strategy simulation * Support for 14,000+ tickers with a personal data key * Learning resources for beginners
Screenshots
Reviews (0)
No reviews yet. Be the first to rate this product!
Comments (0)
No comments yet. Be the first to share your thoughts!