
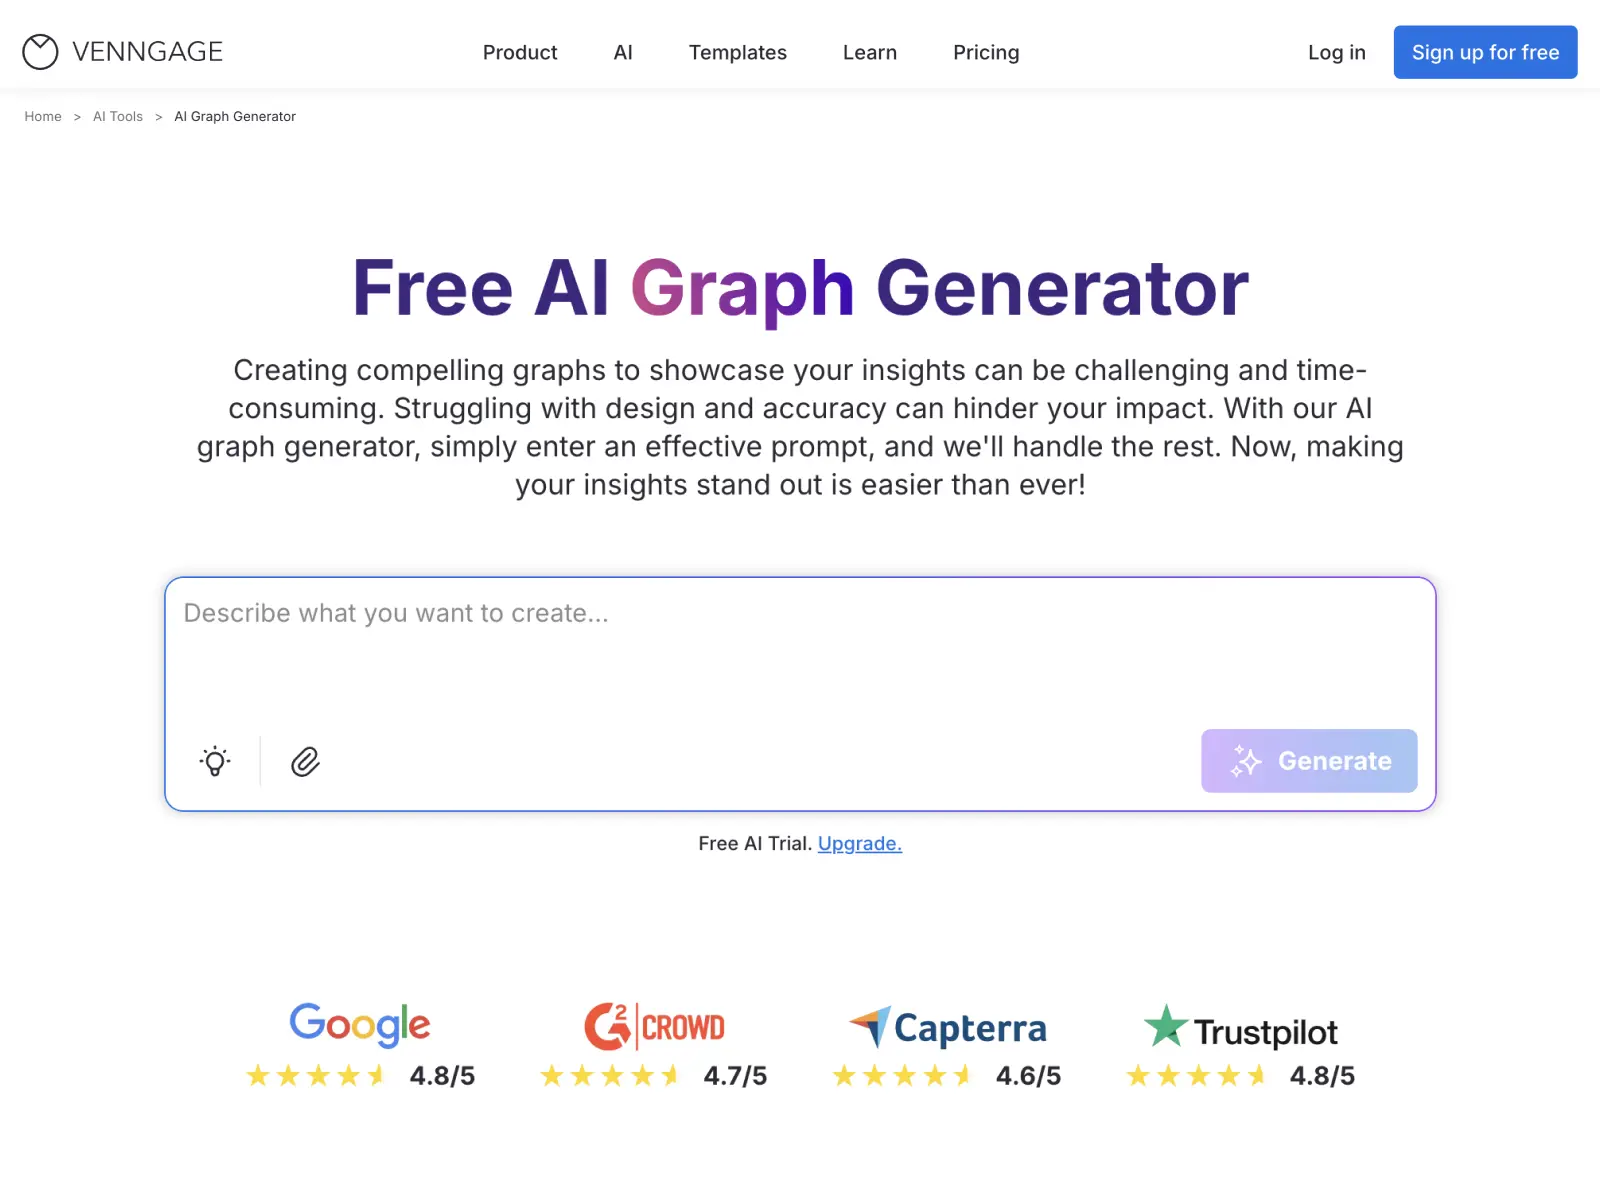
AI Graph Generator
Turn raw data into clear, AI-generated graphs in seconds.
Details
- Follow on
- Categories
- AINo-Code / Low-CodeDesign Tools
- Target Audience
- Non-Technical UsersEducatorsProduct Managers
- Platforms
- Web
About AI Graph Generator
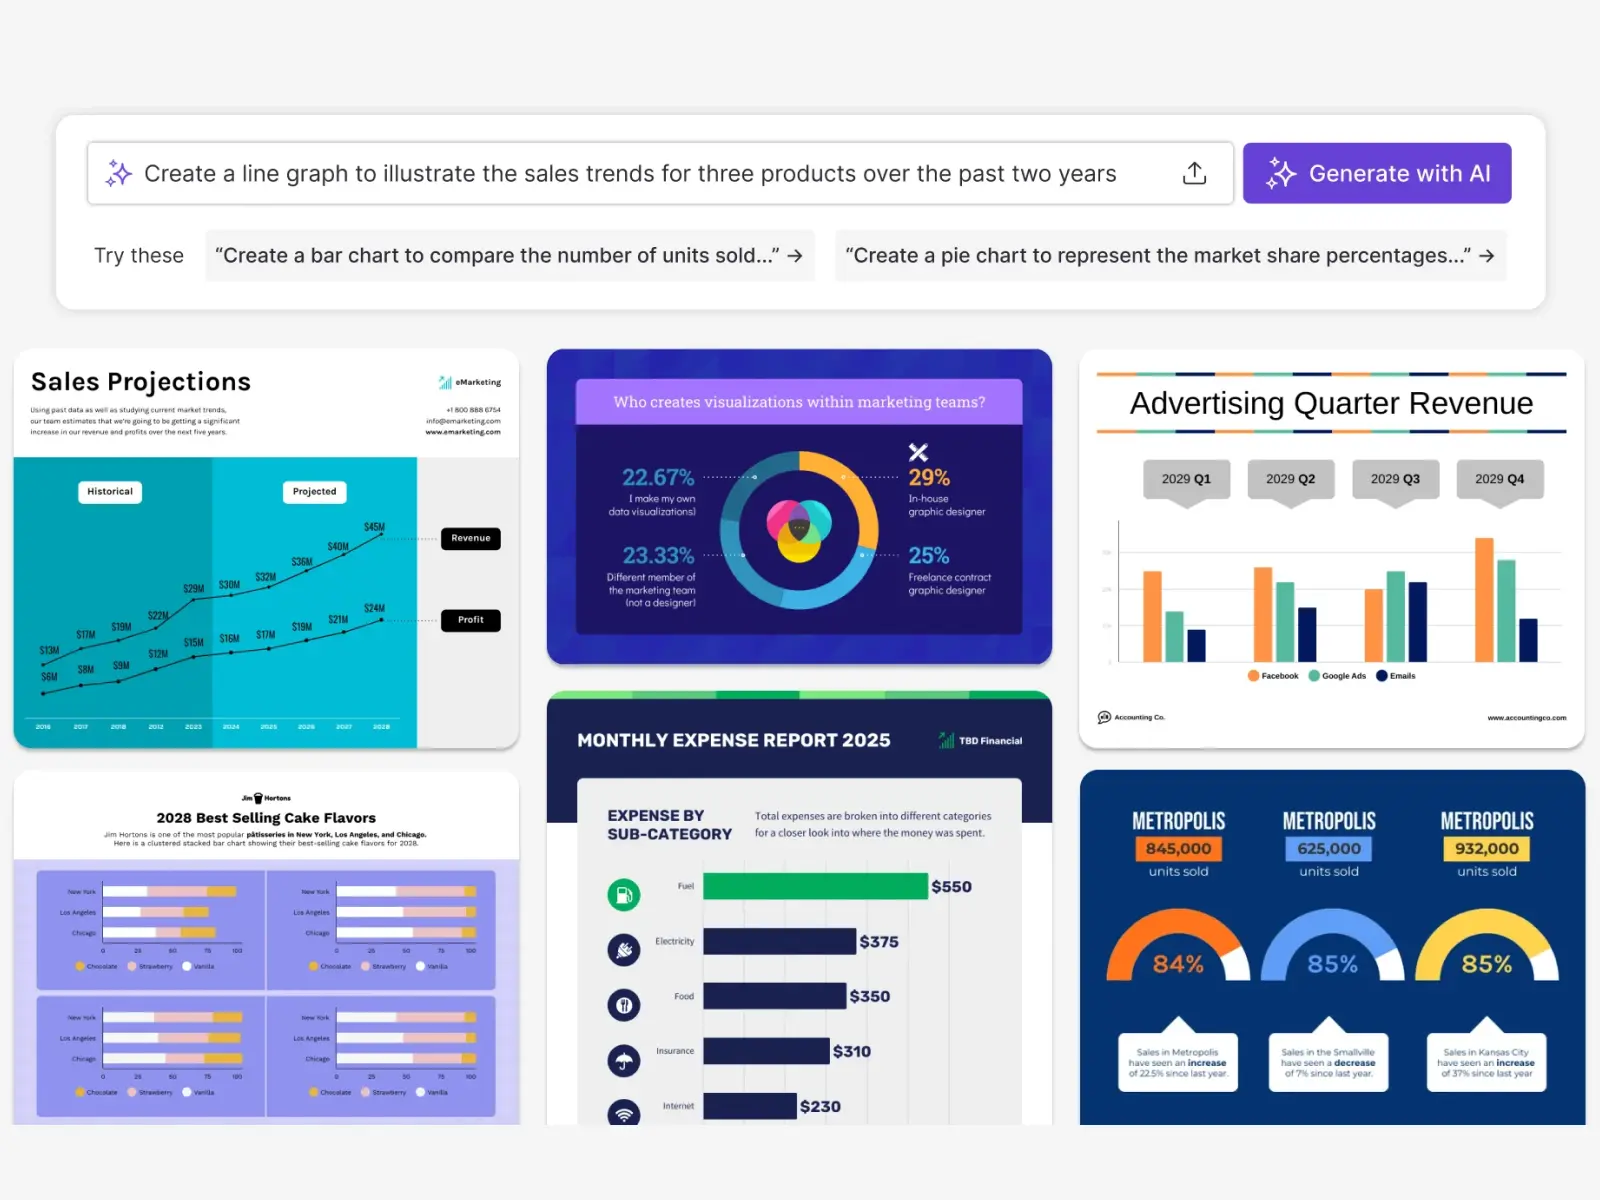
The AI Graph Generator helps you turn raw data into clear, accurate graphs using simple inputs. Designed for business teams, educators, and analysts, it creates presentation-ready visuals in seconds with no spreadsheets or manual formatting required. Key Features - Prompt-to-Graph Generation: Describe your data in plain language or paste it in, and the AI instantly creates a clear, well-labeled graph. - Smart Graph Type Detection: Automatically selects the most suitable graph type—bar, line, pie, or area—based on your data and intent. - Automatic Labeling & Scaling: Applies accurate axes, legends, and data scaling for clean, easy-to-read visuals. - Editable Graph Designs: Customize colors, fonts, and layout to match your brand or presentation style. - Multiple Graph Formats: Generate bar graphs, line graphs, pie charts, and more from a single AI-powered tool. Benefits - Create Graphs Faster: Turn raw data into ready-to-use graphs in seconds without manual setup or formatting. - Simplify Data Analysis: Make trends and comparisons easier to understand with clear, well-structured visuals. - Reduce Manual Errors: Let the AI handle scaling, labels, and layout for more accurate graphs. - Communicate Insights Clearly: Share data in a visual format that’s easy for any audience to understand. - Work Without Spreadsheets: Generate graphs directly from prompts or pasted data with no complex tools required.
Screenshots
Reviews (0)
No reviews yet. Be the first to rate this product!
Comments (0)
No comments yet. Be the first to share your thoughts!