
Chartsy
Subscription analytics that adapt to your business.
Details
- Follow on
- @chartsyappLinkedIn
- Target Audience
- Founders & CEOsIndie HackersSmall Businesses
- Pricing
- Subscription from $29
- Platforms
- Web
- Alternative To
 ChartMogul
 Baremetrics
Discovery signals
How AI and people discover Chartsy on PeerPush
About Chartsy
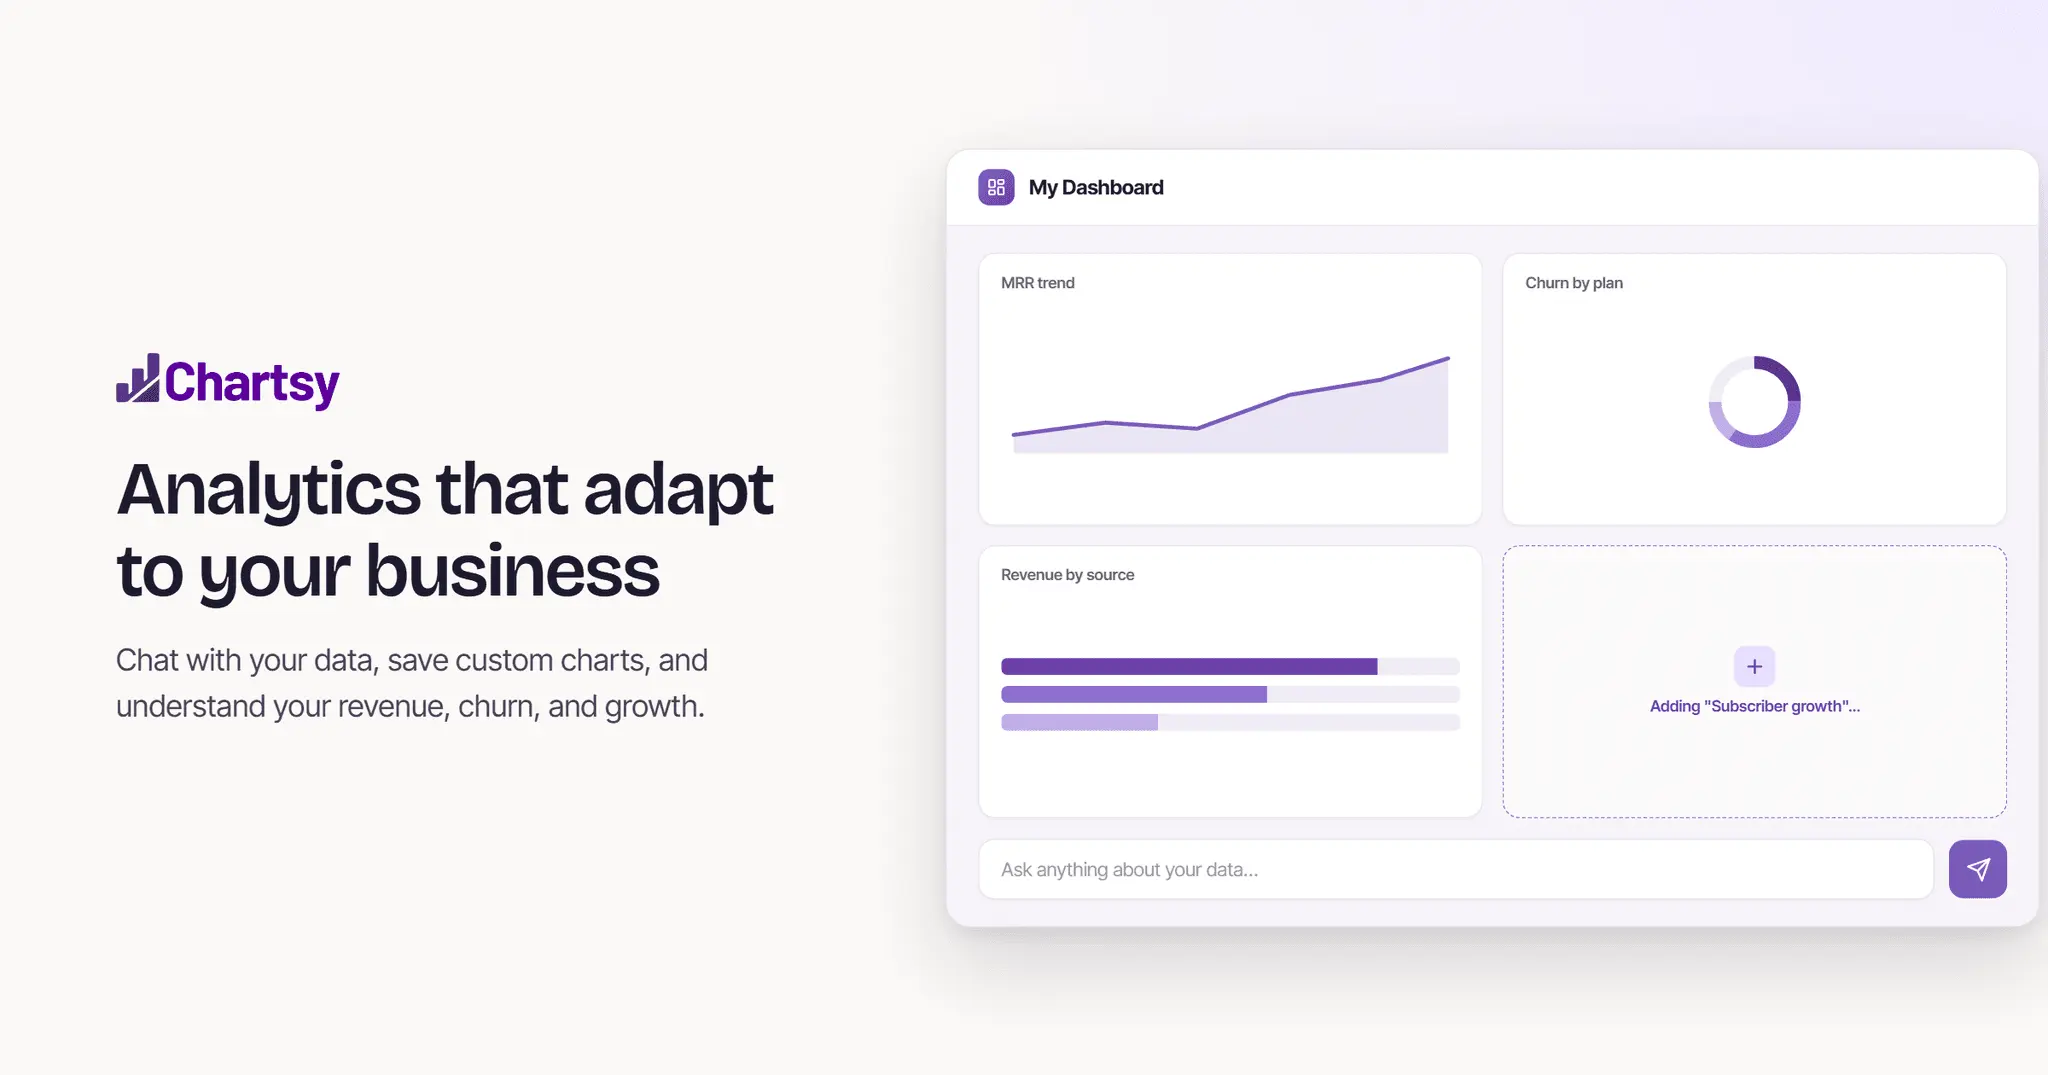
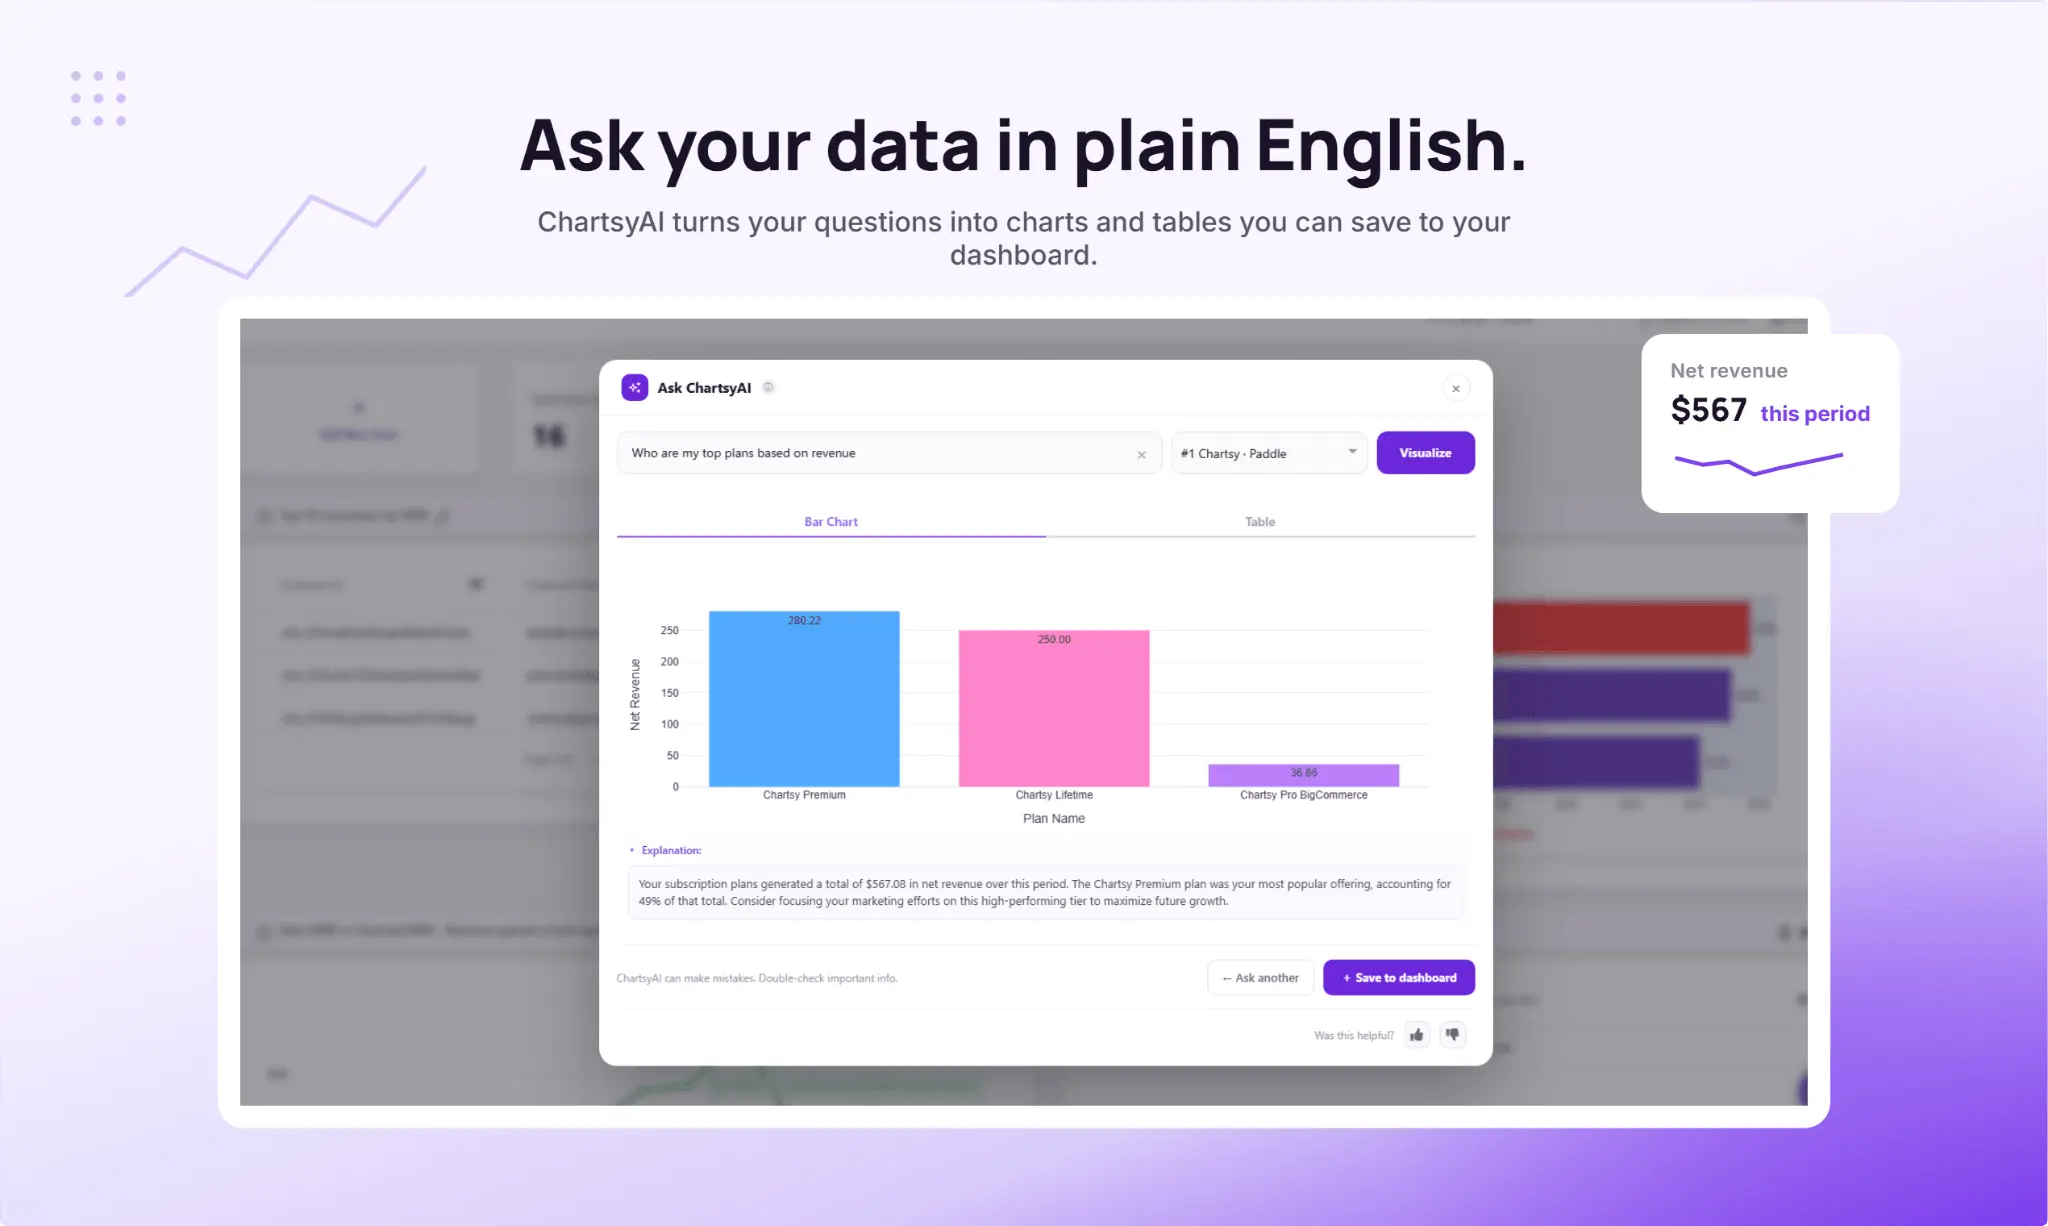
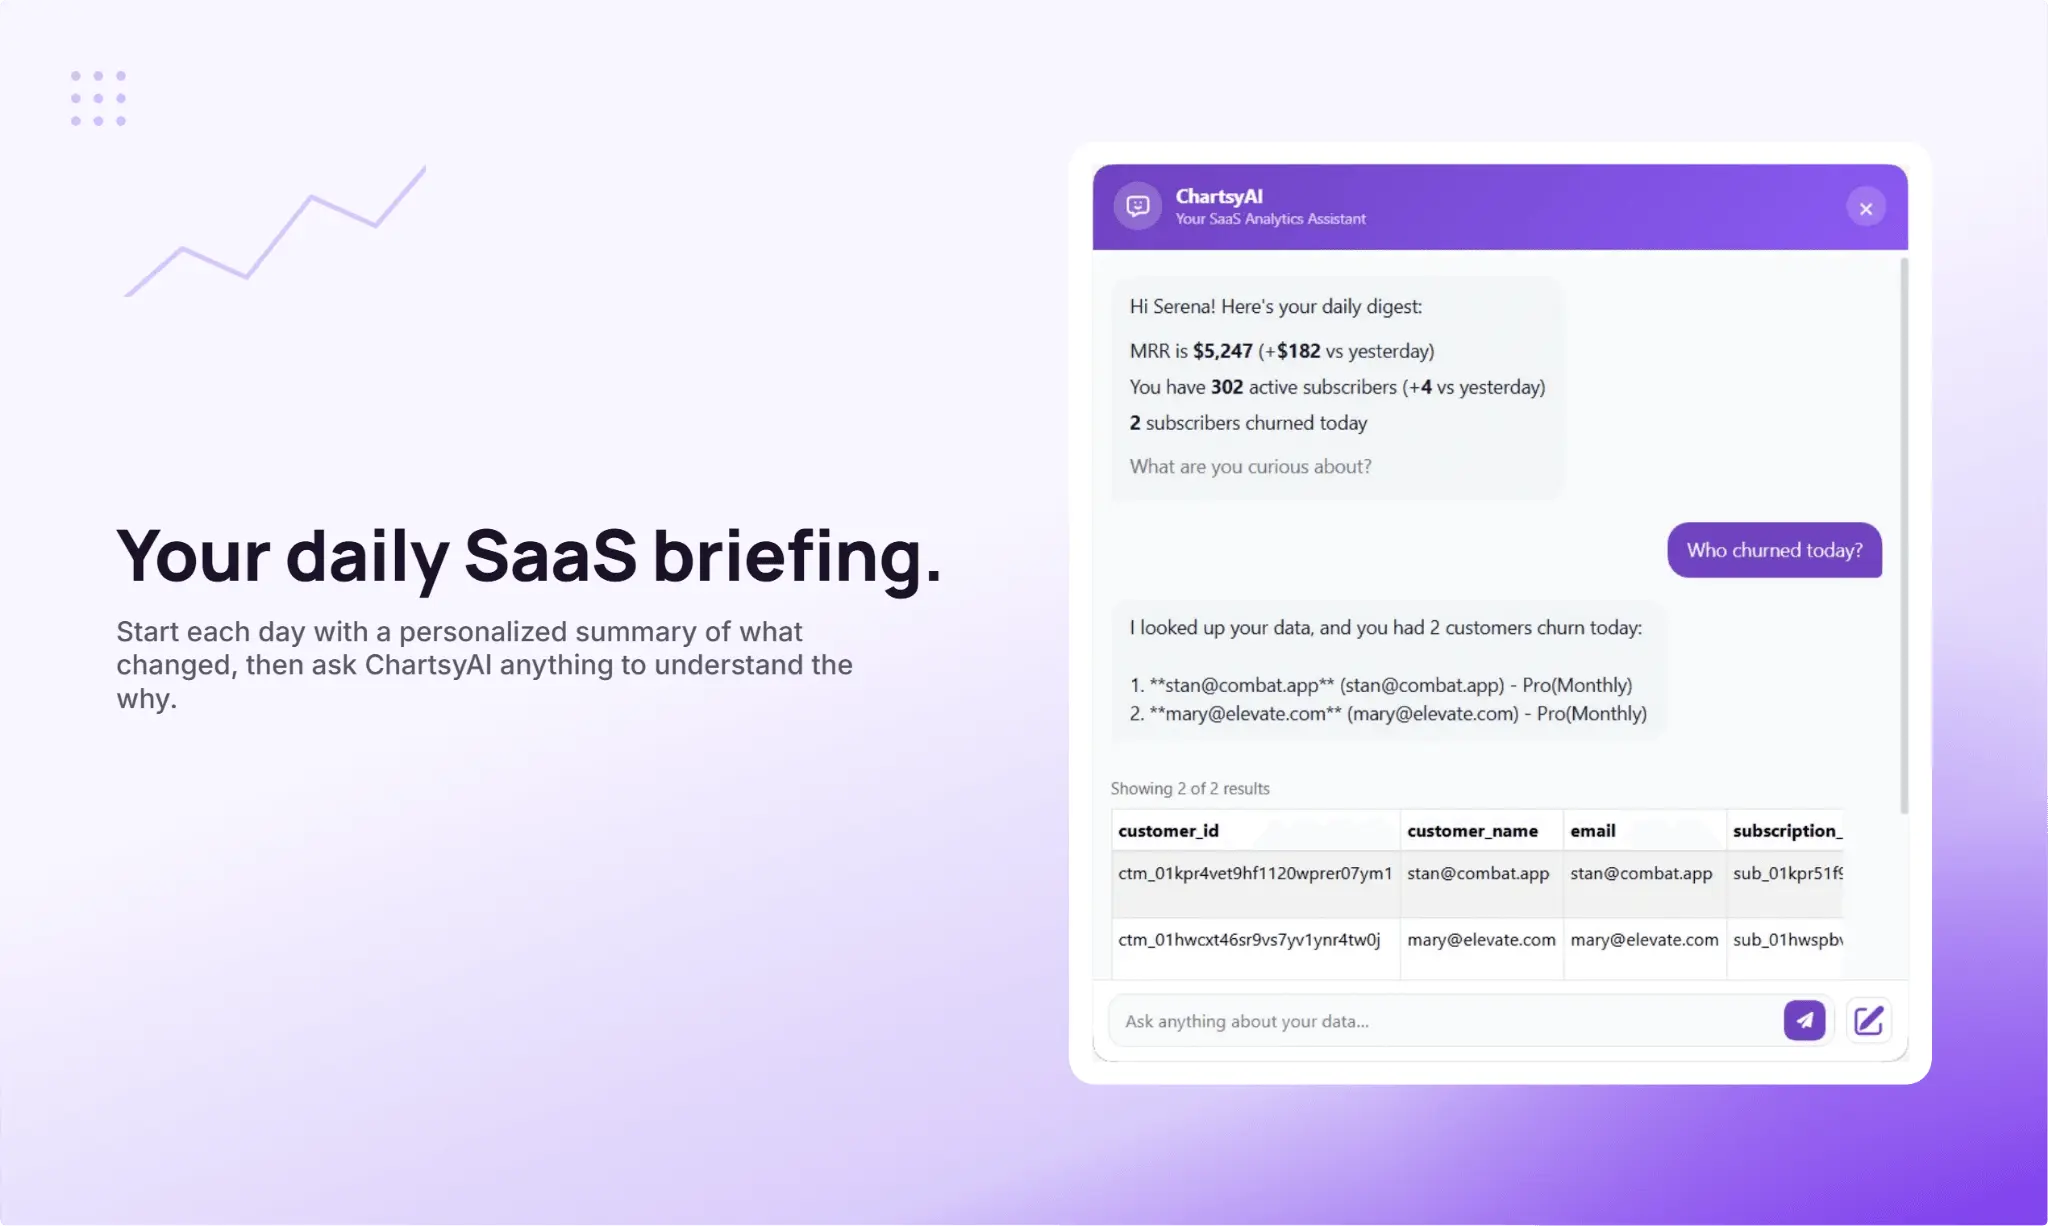
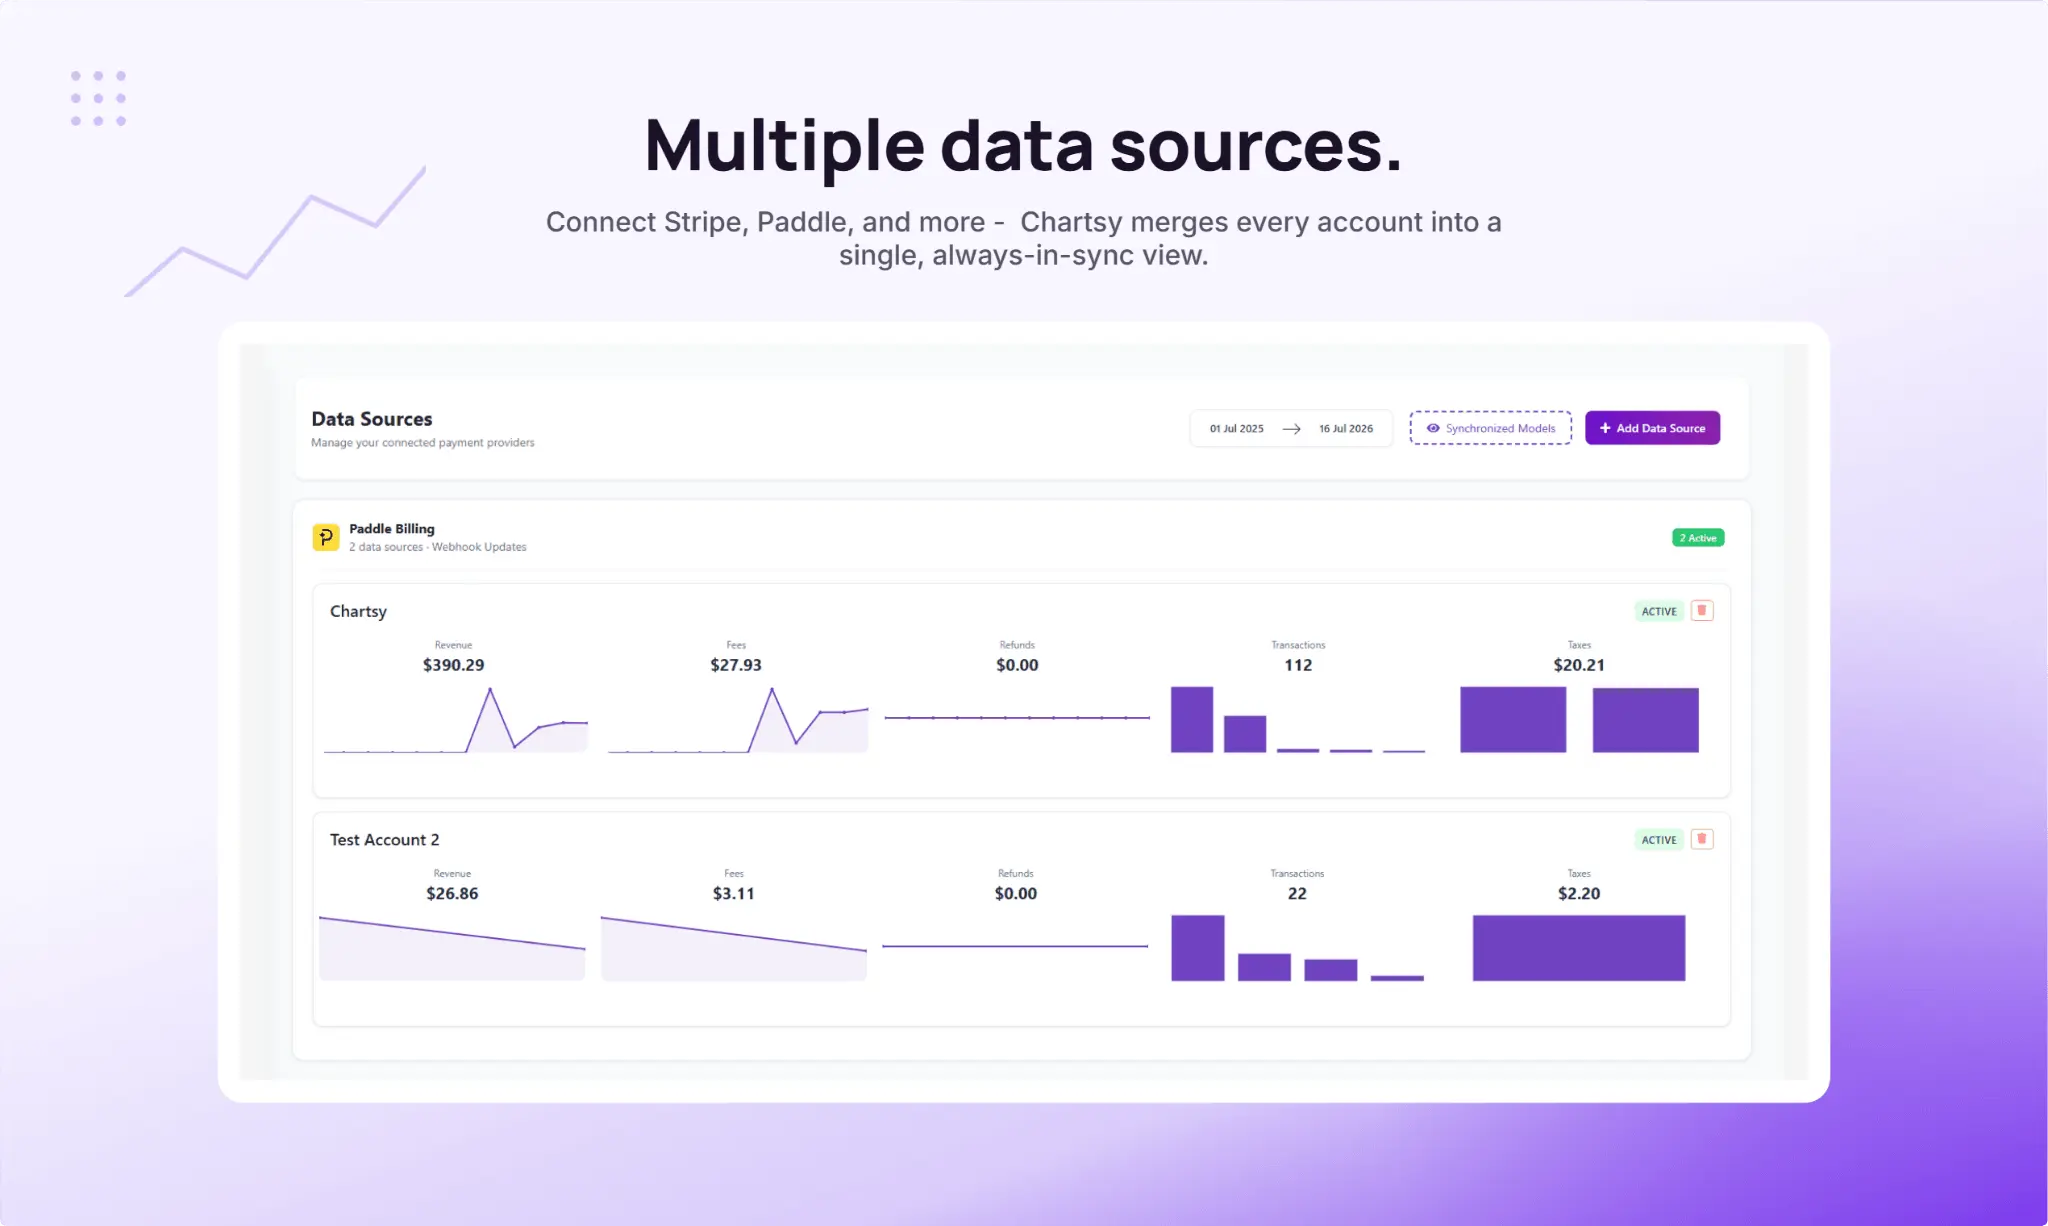
Chartsy is a new way of doing subscription analytics for SaaS businesses. Instead of overwhelming teams with static dashboards and complicated BI tools, Chartsy turns subscription data into a story about how the business is actually performing - what is growing, what is slowing down, where revenue is coming from, and which customers are most valuable. By connecting Stripe or Paddle, businesses instantly get access to pre-built analytics dashboards for MRR, ARR, churn, retention, LTV, failed payments, refunds, subscription growth, and plan performance. One of Chartsy’s core features is its dedicated MRR dashboard breakdown, which helps businesses clearly understand how recurring revenue changes over time through upgrades, downgrades, new subscriptions, churn, reactivations, and expansion revenue. Chartsy also includes metadata analytics, allowing teams to analyze custom Stripe or Paddle metadata and uncover patterns across customer types, plans, locations, acquisition channels, internal tags, and any other custom business-specific data associated with subscriptions and payments. The platform’s built-in AI analytics engine allows users to ask personalized questions about their own data in plain English. Instead of filtering spreadsheets or writing SQL queries, users can ask questions like: • “Why did churn increase this month?” • “Which customers generate the highest revenue?” • “Show me expansion revenue trends.” • “What changed in MRR compared to last quarter?” Chartsy then generates instant charts, graphs, and explanations directly from the connected subscription data. Features include: • Dedicated MRR dashboard breakdown • Metadata analytics for custom business data • AI-powered subscription analytics • Plain English data exploration • AI-generated charts and visualizations • Pre-built dashboards for SaaS metrics • MRR, ARR, churn, retention, and LTV tracking • Revenue, refund, and failed payment analytics • Subscription plan performance insights • Fully customizable dashboards • Scheduled email reports • Exportable PNG and PDF visualizations • Stripe and Paddle integrations • No SQL or technical expertise required Chartsy is built for SaaS founders and teams who want to understand their business faster, ask deeper questions about their data, and move beyond static analytics dashboards.
Screenshots
Product Updates (2)
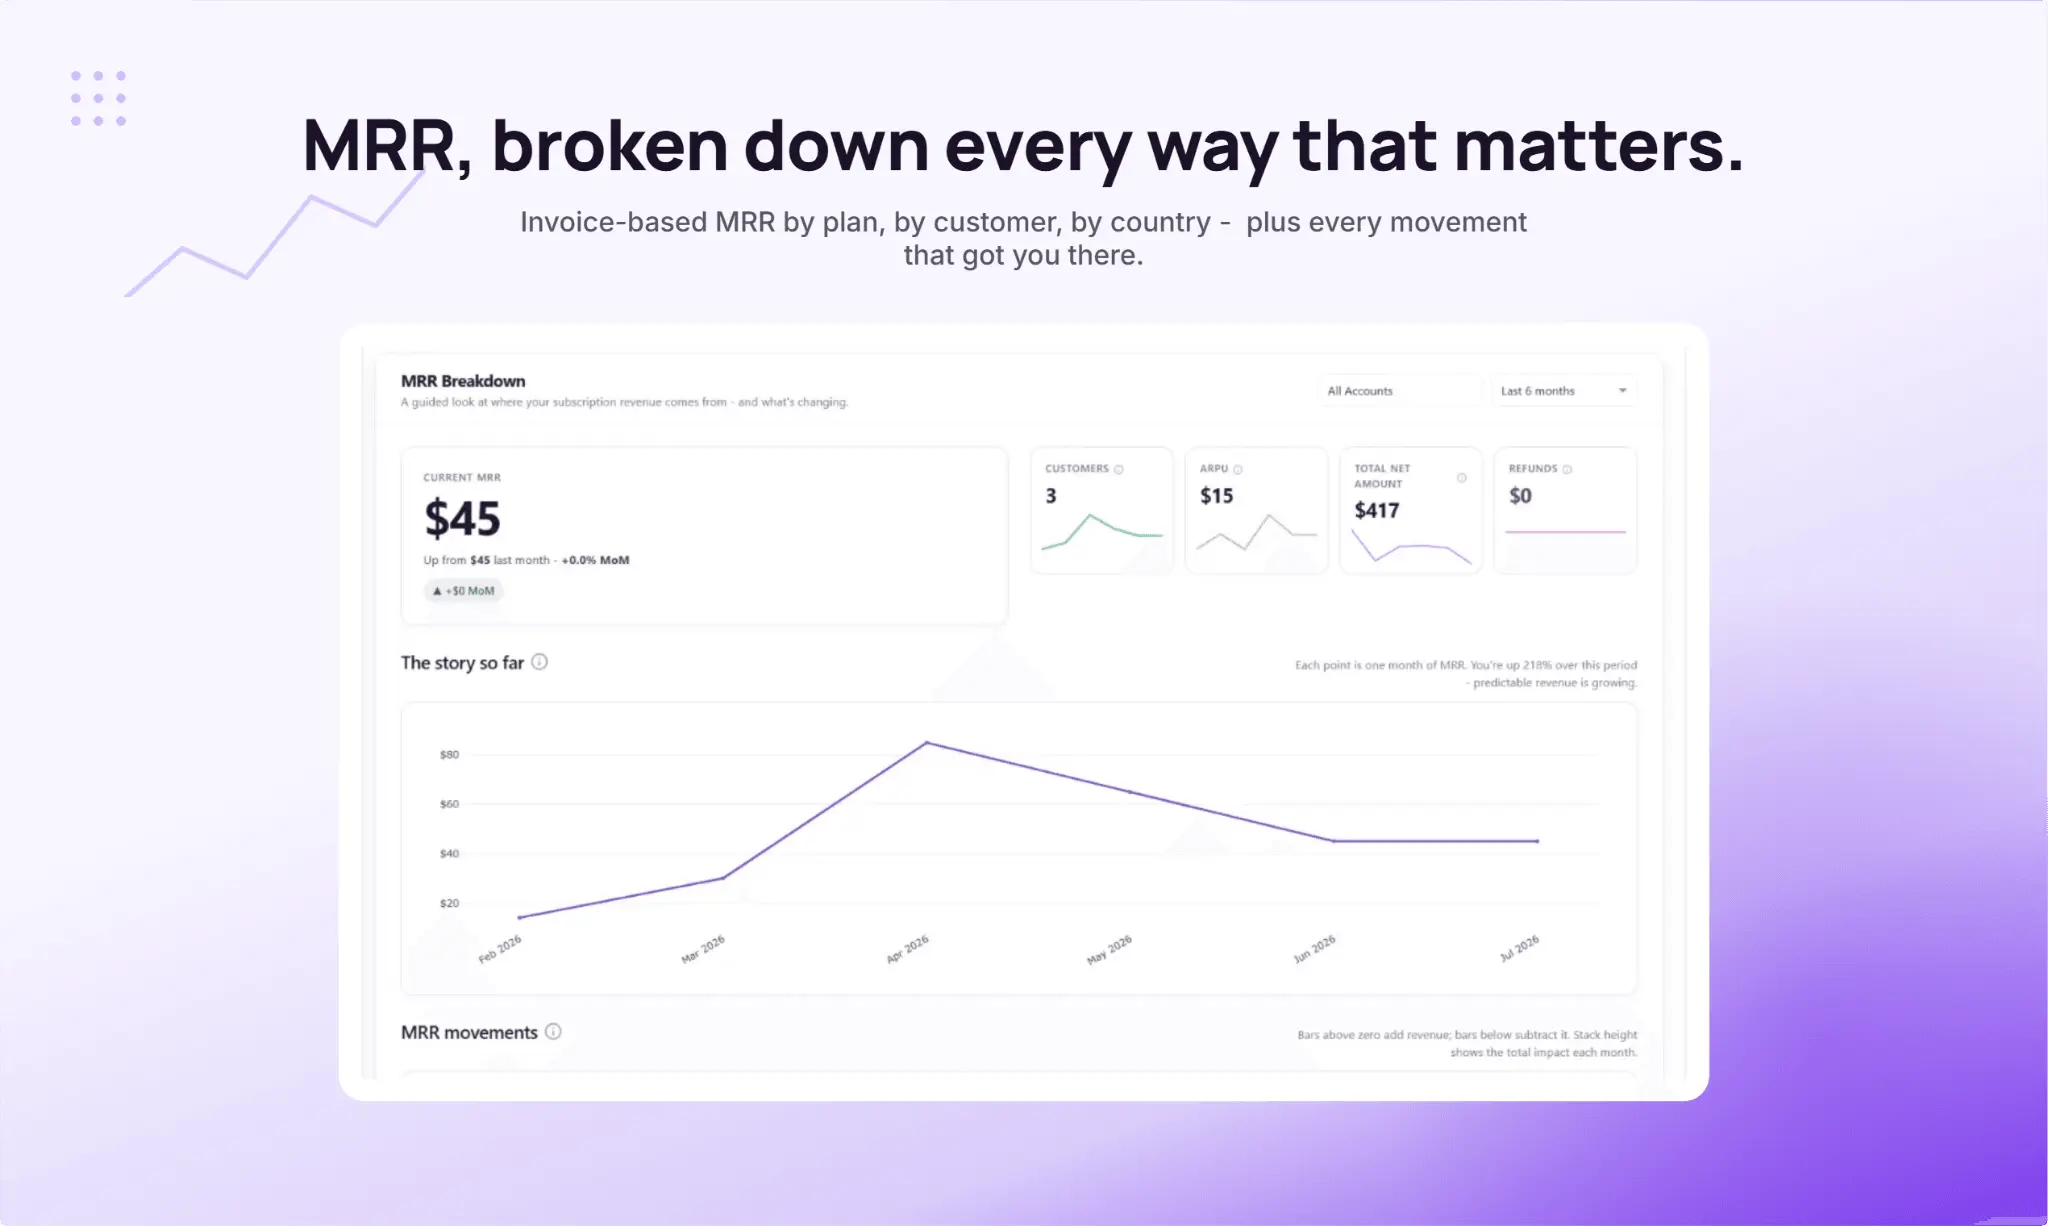
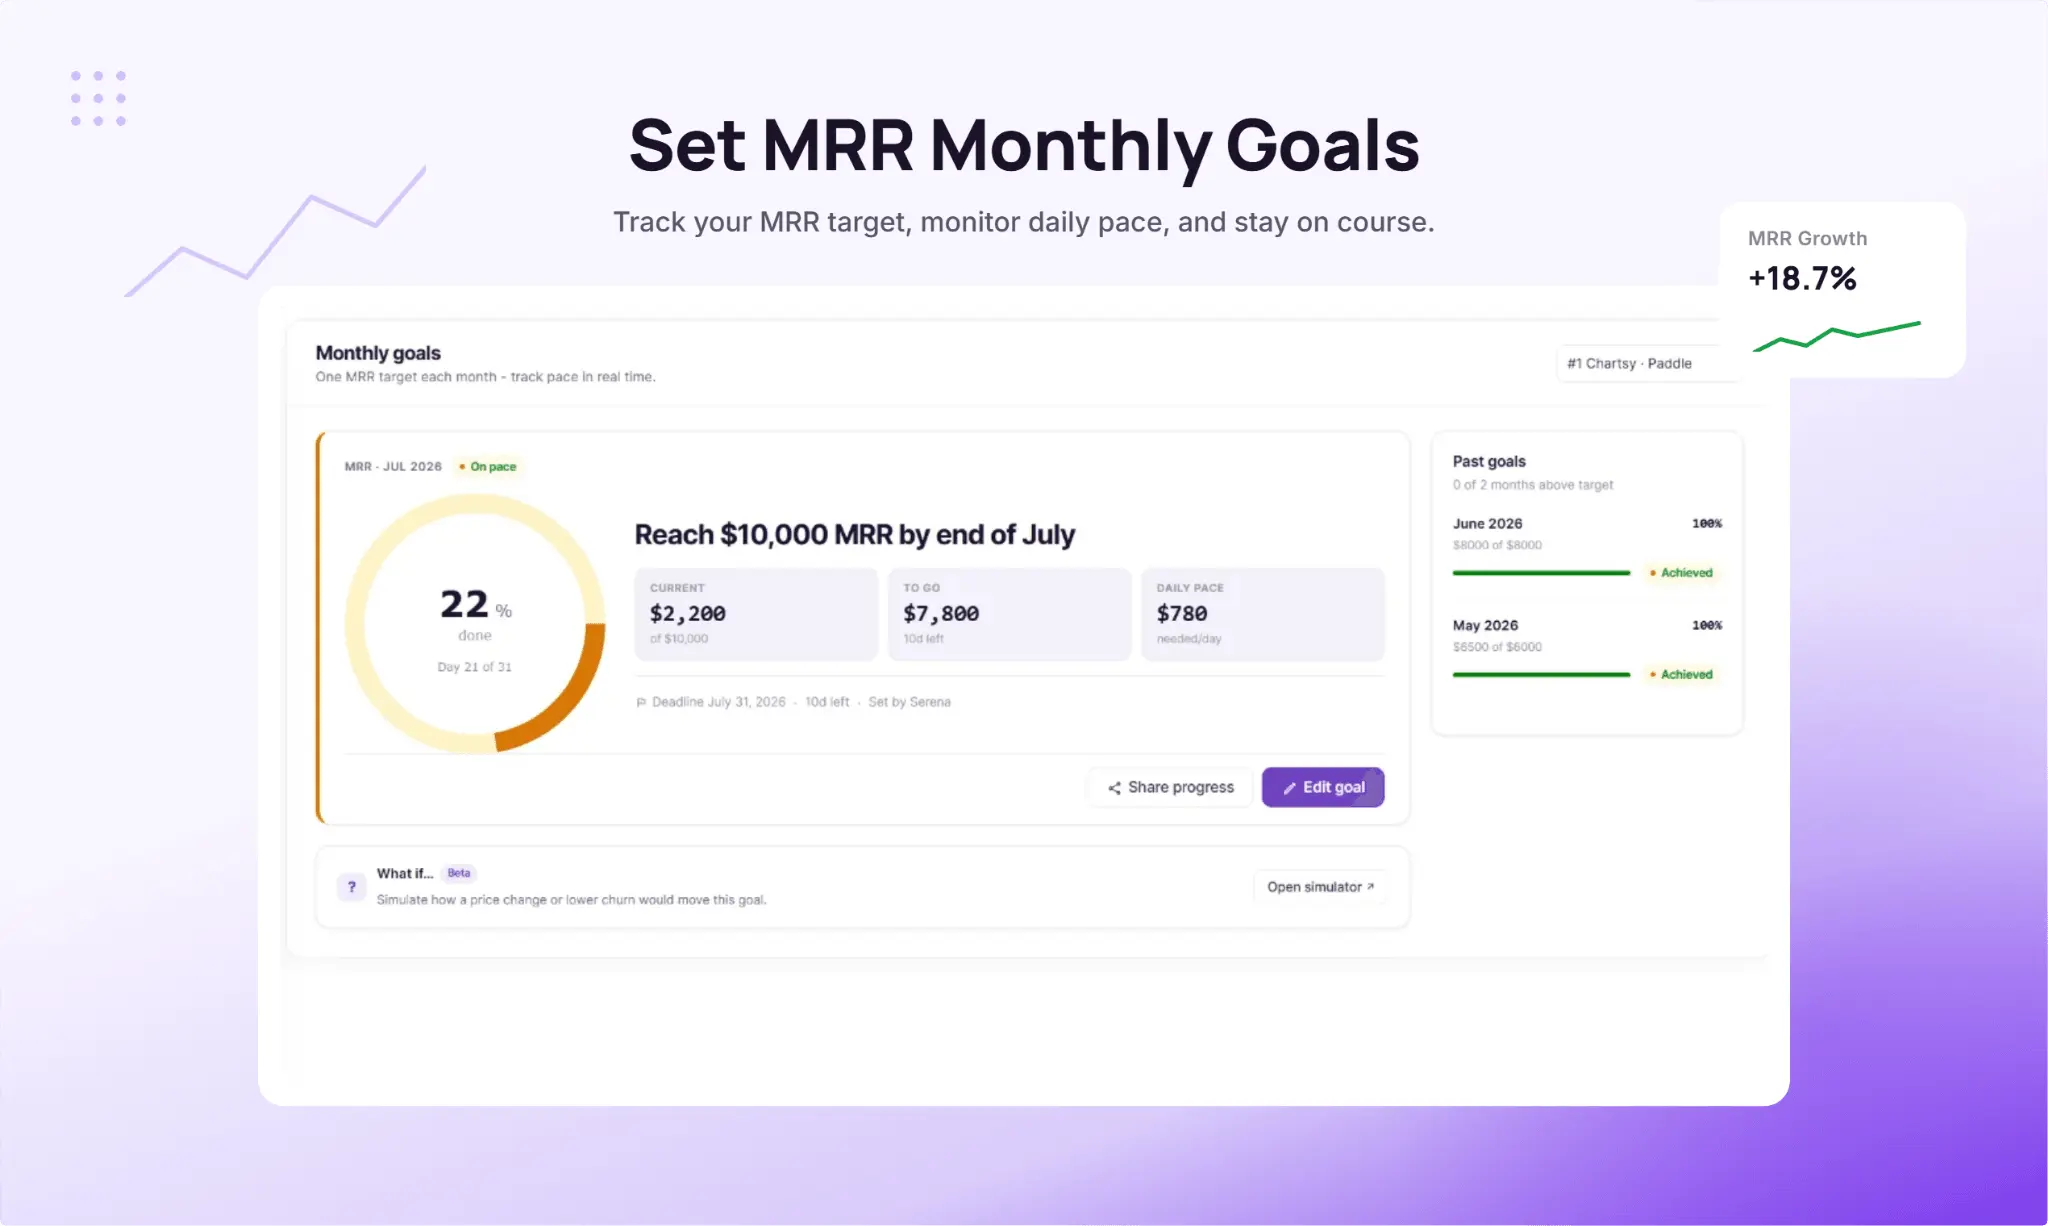
Dedicated MRR Breakdown Dashboard
Chartsy now includes a dedicated MRR Breakdown Dashboard designed to help SaaS businesses understand exactly how recurring revenue changes over time. Instead of seeing only a final MRR number, businesses can now break down MRR by: • Subscription plans • Individual customers • New subscriptions • Expansion revenue • Upgrades and downgrades • Reactivations • Churned revenue The dashboard turns MRR into a clear story of business growth, helping founders and teams quickly understand what is driving revenue changes month by month and which customers or plans contribute most to revenue growth.
Comments (0)
No comments yet. Be the first to share your thoughts!
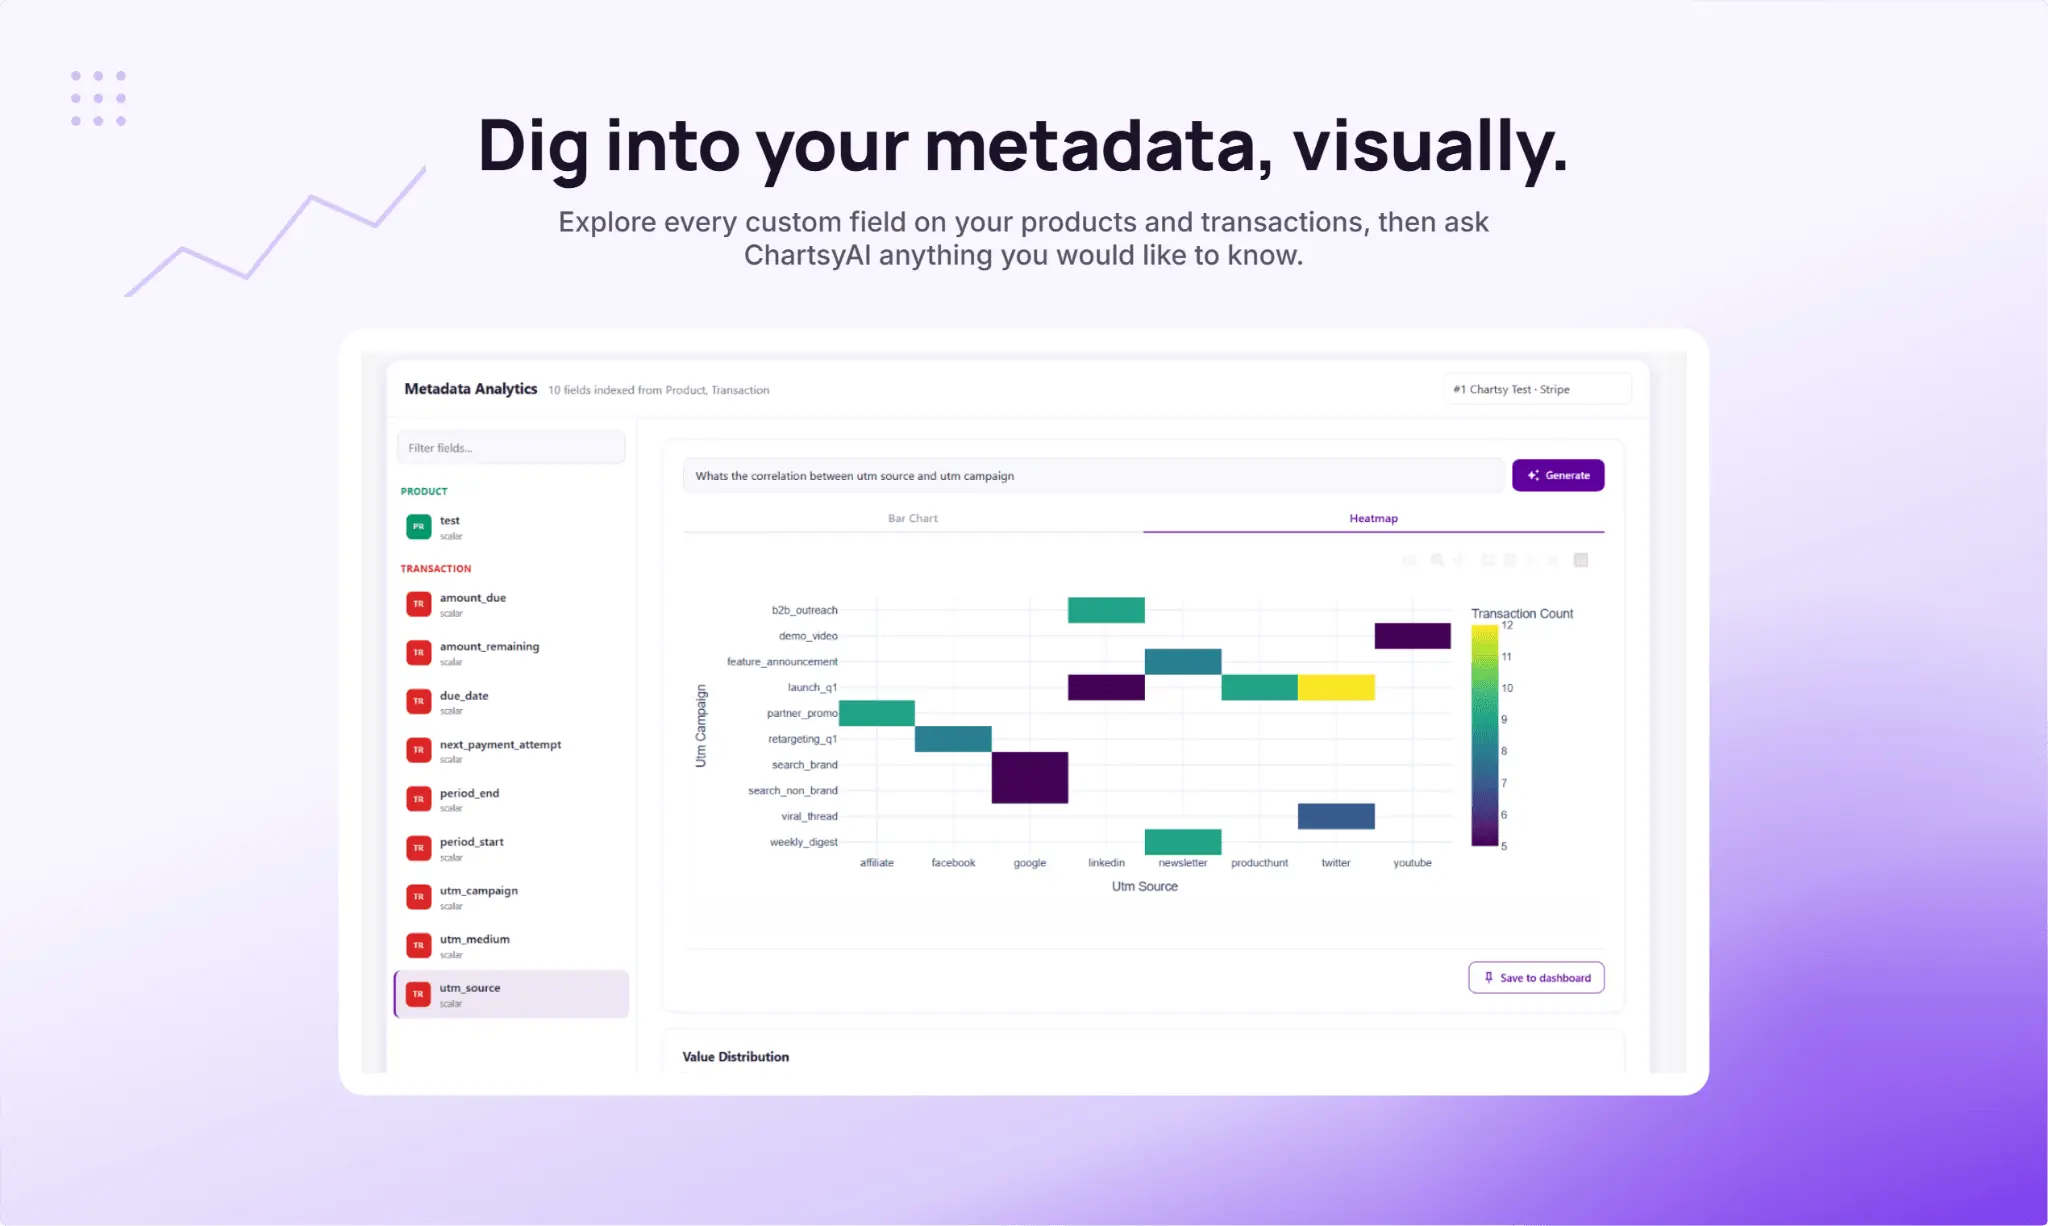
Metadata Analytics
Most subscription analytics tools only show standard metrics. Chartsy now goes deeper with Metadata Analytics, allowing SaaS businesses to analyze custom Stripe and Paddle metadata directly inside their dashboards. Track revenue, churn, retention, and customer behavior based on your own business-specific data, such as acquisition channels, customer types, internal tags, locations, sales reps, product categories, or any custom metadata attached to subscriptions and payments. Instead of being limited to generic reports, you can finally explore the questions unique to your business and uncover patterns that traditional analytics tools usually miss.
Comments (0)
No comments yet. Be the first to share your thoughts!
Reviews (0)
No reviews yet. Be the first to rate this product!
Comments (0)
No comments yet. Be the first to share your thoughts!