
Dashira
Turn your data into beautiful and shareable dashboards
Details
- Follow on
- @pallaxa
- Target Audience
- Product ManagersData ScientistsNon-Technical Users
Discovery signals
How AI and people discover Dashira on PeerPush
About Dashira
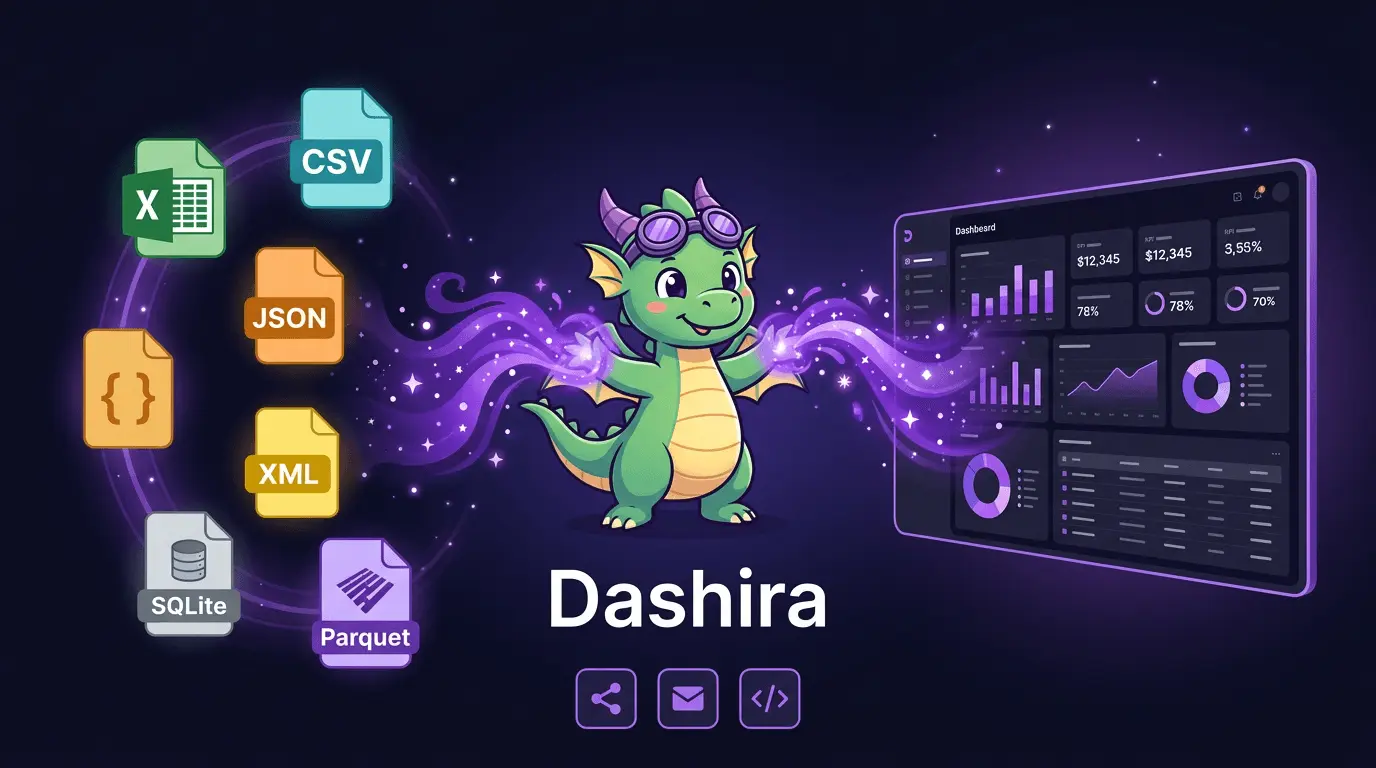
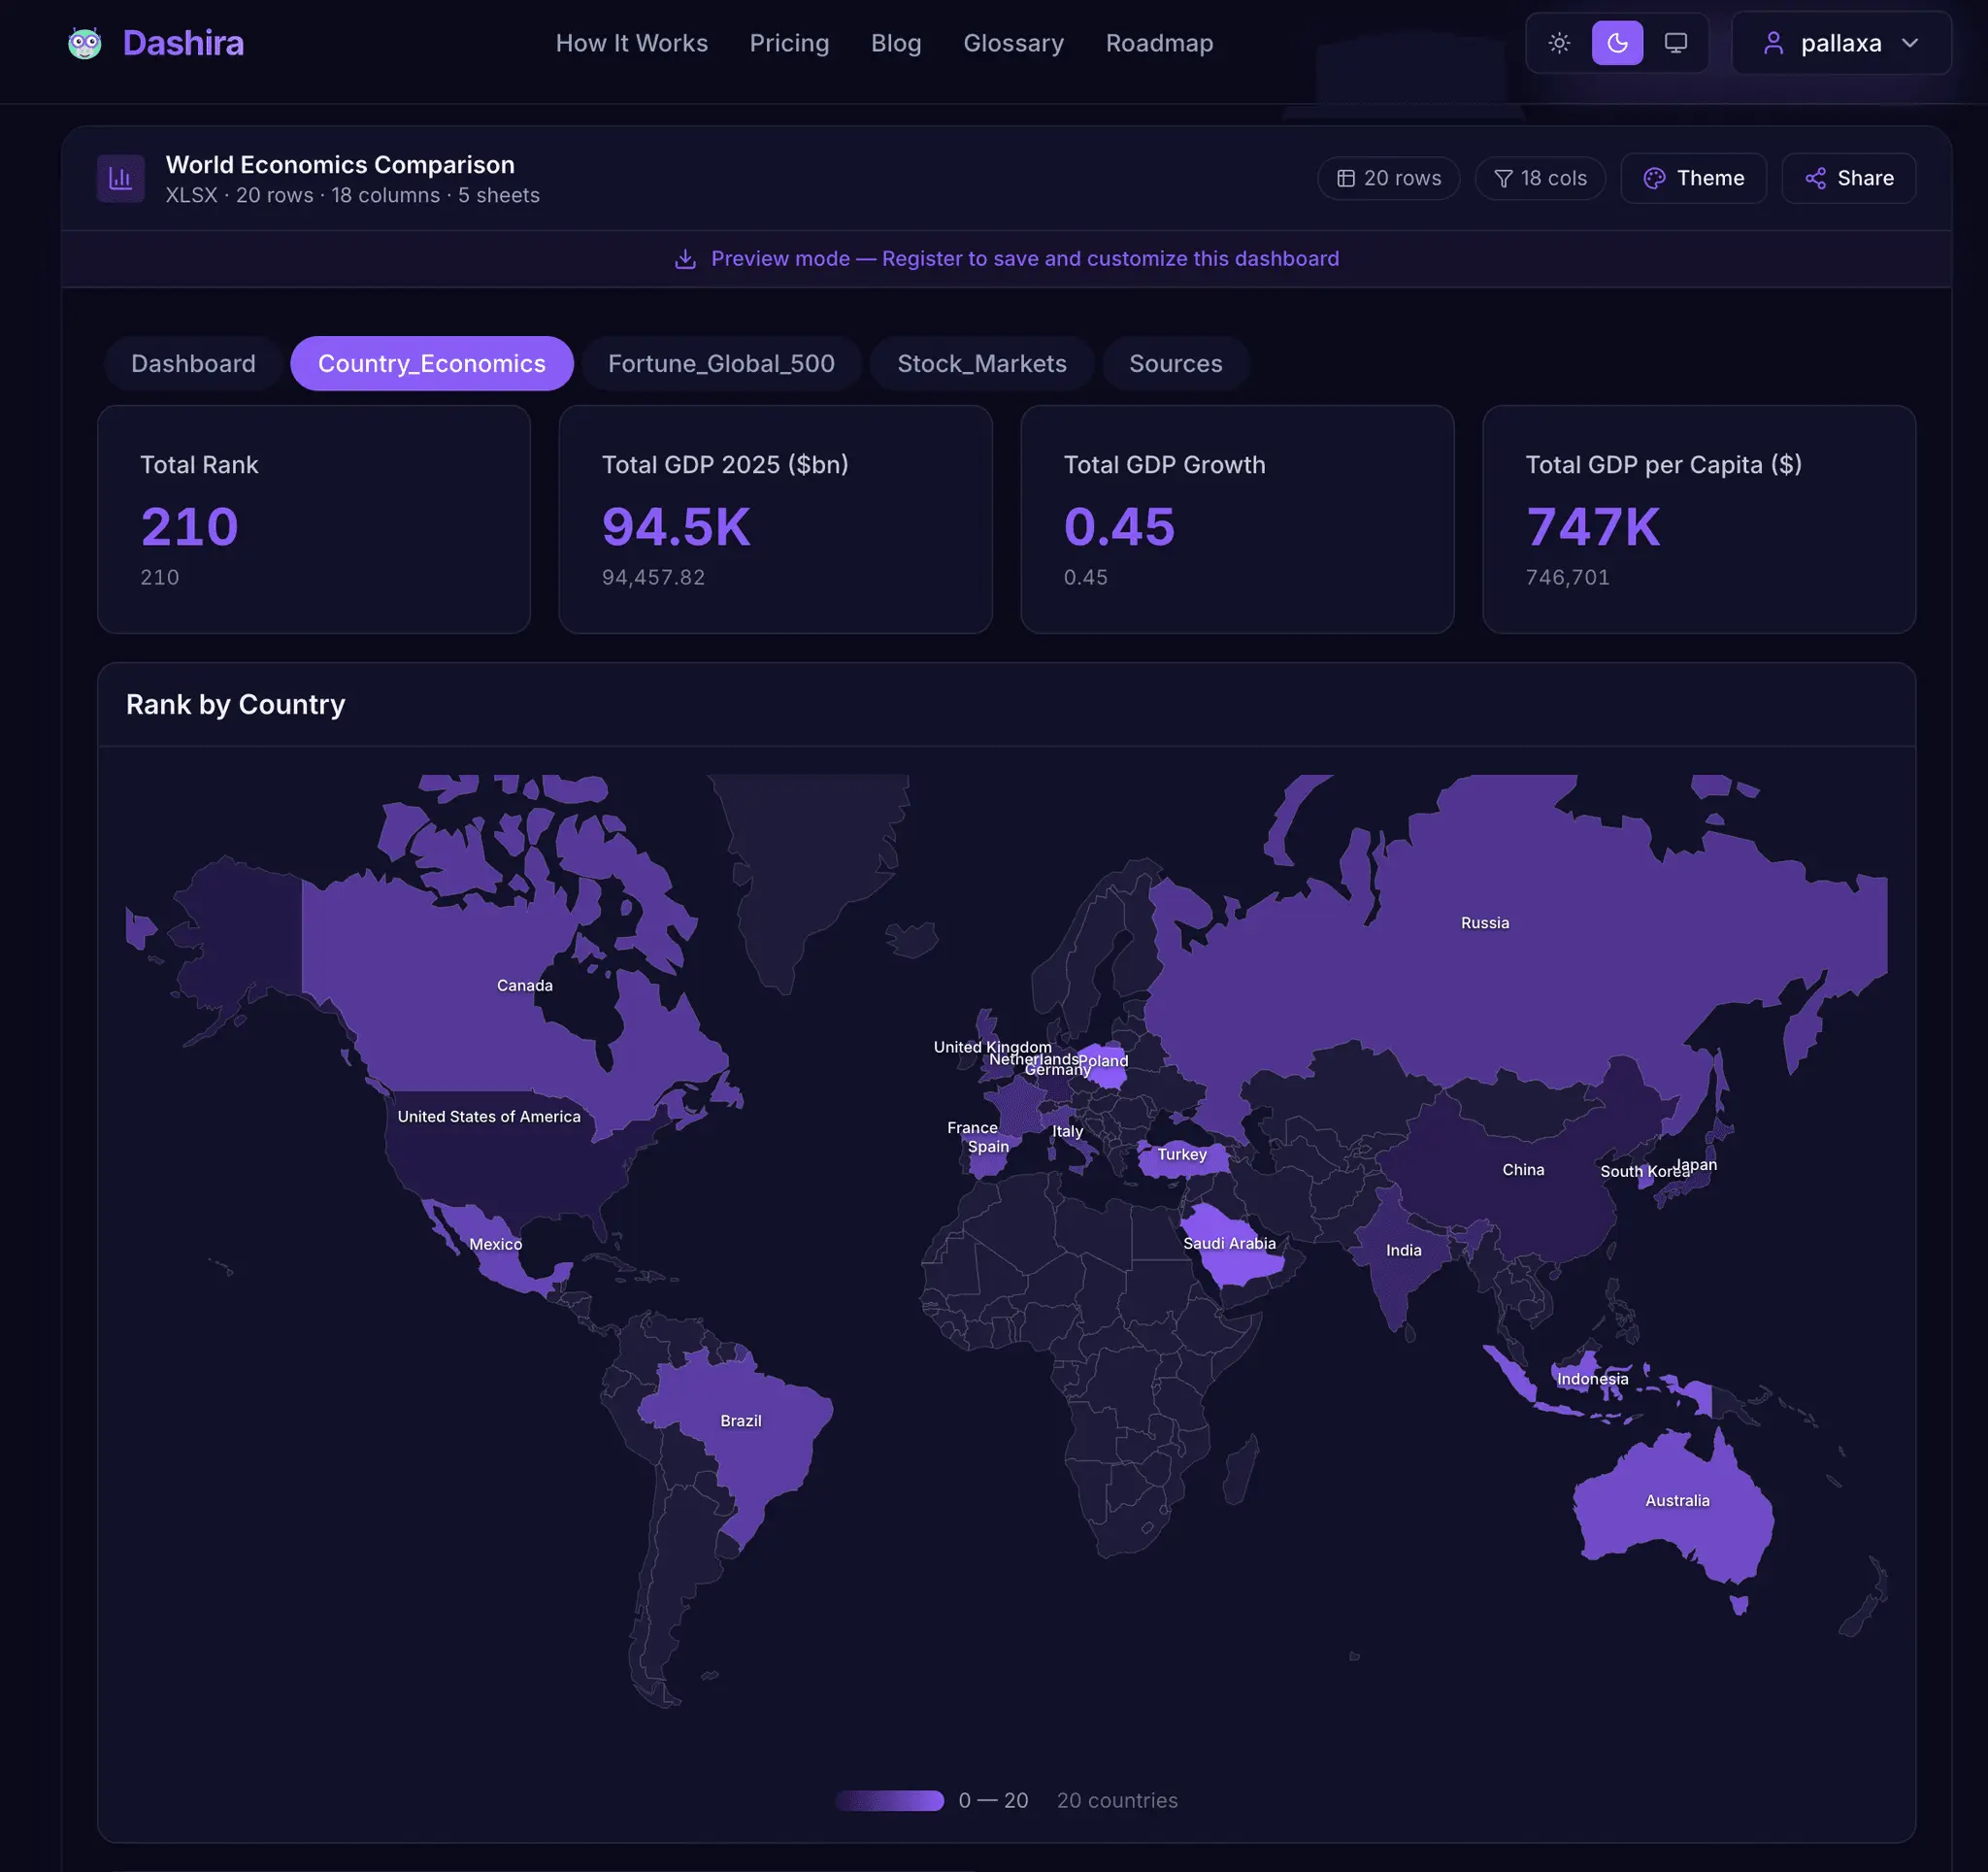
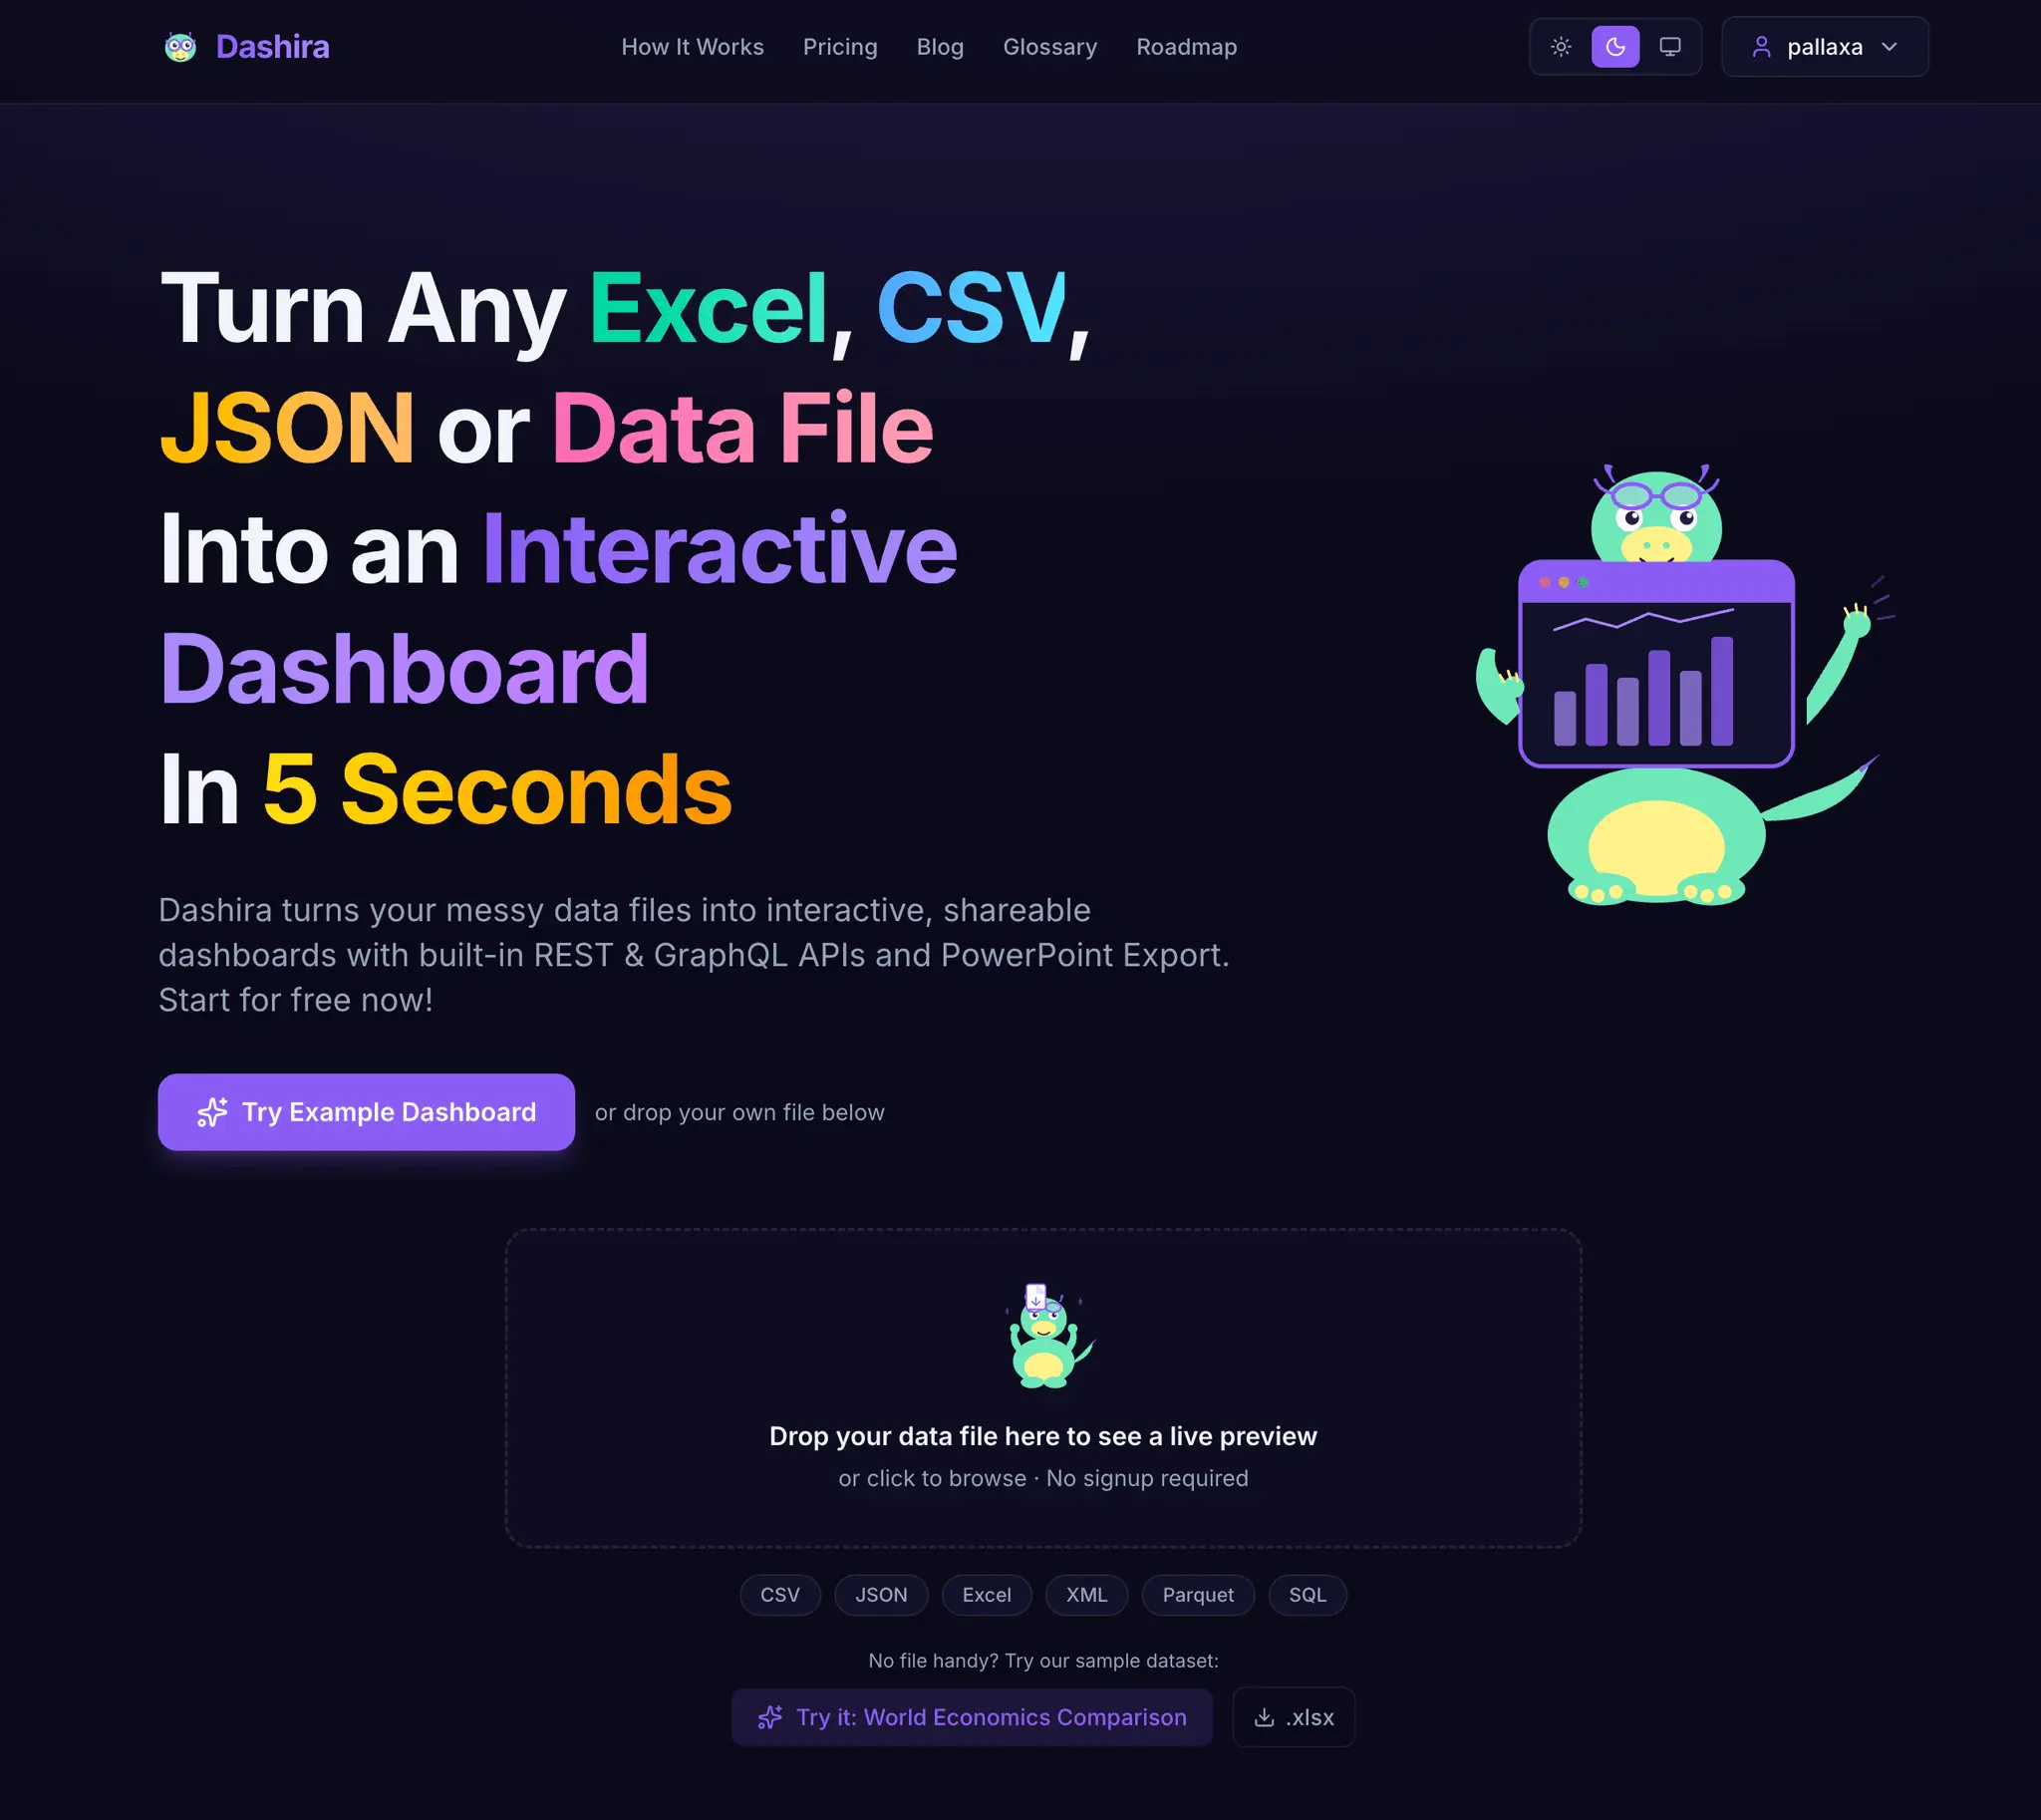
Dashira allows you to transform raw data into professional, visually appealing dashboards with ease. You can upload your data and immediately generate shareable insights that come with built-in APIs for seamless integration. It is designed to help you communicate data effectively while providing a quick setup process that is free to start. Whether you need to visualize metrics for your team or create accessible data endpoints, this tool streamlines the entire process from file upload to final presentation. Dashira turns any Excel, CSV, JSON or Data File into an interactive and shareable dashboards with built-in REST & GraphQL APIs and PowerPoint Export in 5 Seconds.
Product Video
Watch a video demo of Dashira.
Screenshots
Product Updates (1)
Dashira Community Edition
We are proud to announce that dashira will release a community edition very soon that is open source and can be self hosted in your own environment in the same deployment configuration as we also support enterprise installations.
Comments (1)
Love this. Shareable dashboards are such an underrated feature for teams. The ability to turn raw data into something visually clear and easy to share is genuinely useful.
Reviews (0)
No reviews yet. Be the first to rate this product!
Comments (9)
Congrats on the launch!
Love the product!!
Love the concept of turning raw data into visual dashboards without code. How does the data import work — CSV upload or API connections?
@support1202 both are possible any data input like json xml csv or you can also connect apis the agentic system in the background will guide you and figure out how to display your unstructured data
CSV to interactive dashboard in 5 seconds with built-in REST and GraphQL APIs is wild. The PowerPoint export is a nice touch too. Data storytelling made dead simple.
Love the product
@kaushal Thank u very much we keep improving
This idea of generating charts from data is really great and useful in many scenarios.
Really cool concept — turning raw data into shareable dashboards in seconds is a game changer for quick reporting.
great timing with a project I'm working on total lifesaver!
Any data format or feature missing just let me know we are happy to support your use case!