
Oitava
Stock research and portfolio tracking in one place

Details
- Follow on
- Categories
- Use Cases
- Target Audience
- Pricing
- Freemium
- Platforms
 getquin alternatives
 sharesight alternatives
 Koyfin alternatives
Discovery signals
How AI and people discover Oitava on PeerPush
- ChatGPT
- Perplexity
- Claude
- +4 other AI crawlers
Reads by these AI engines
Crawlers behind these engines read this listing on PeerPush.About Oitava
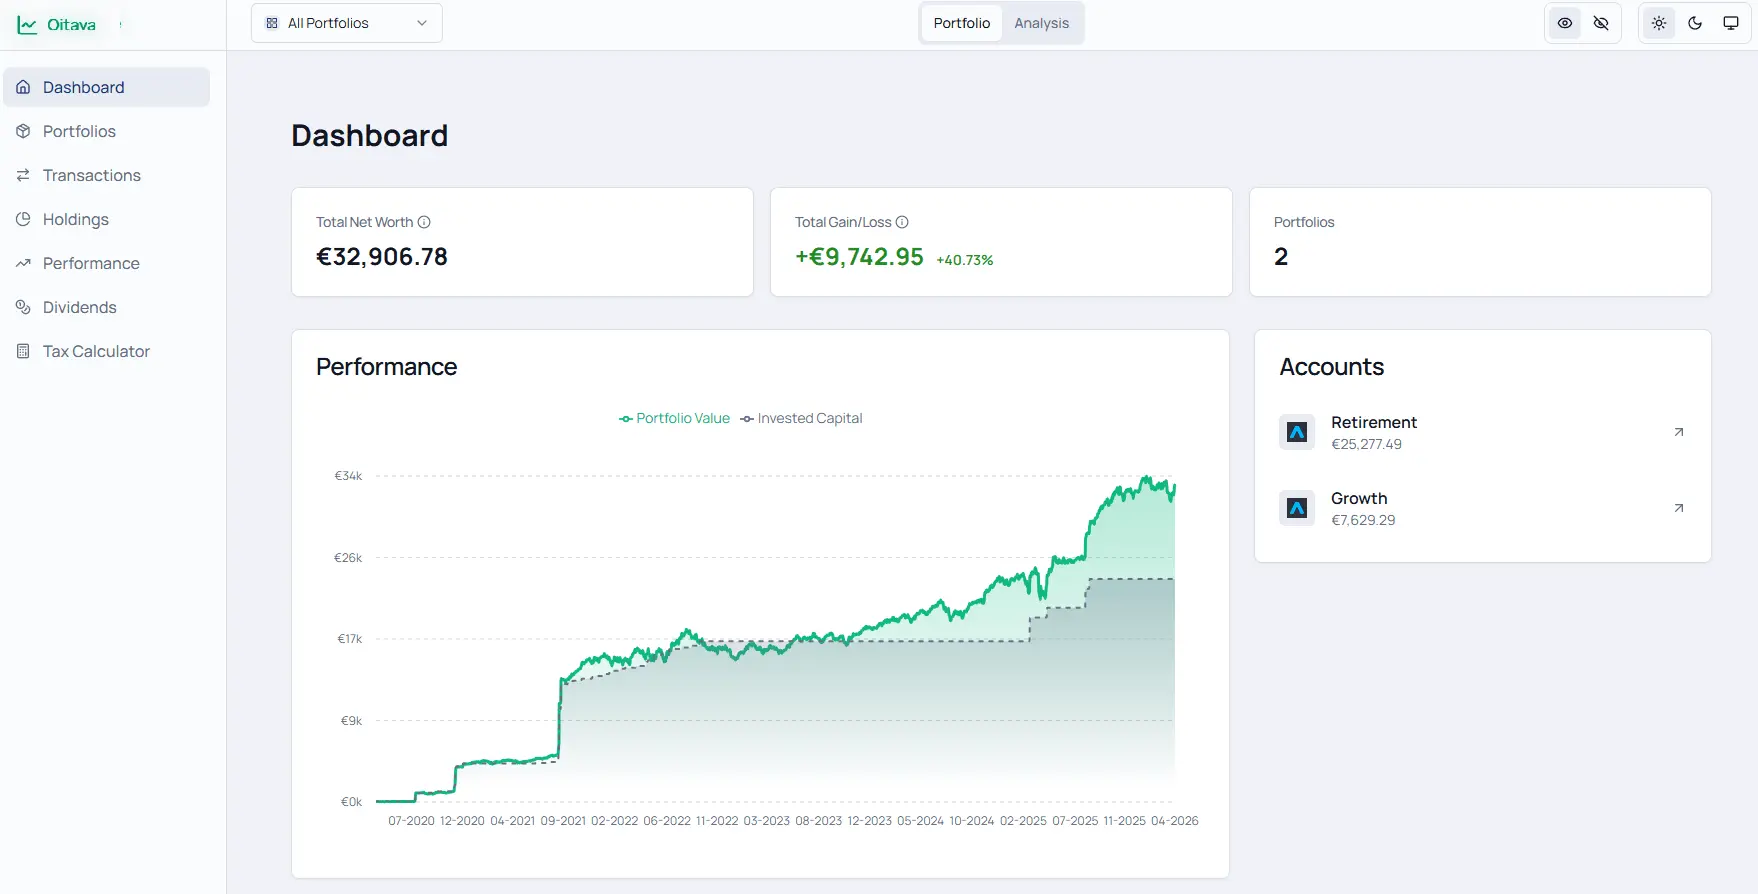
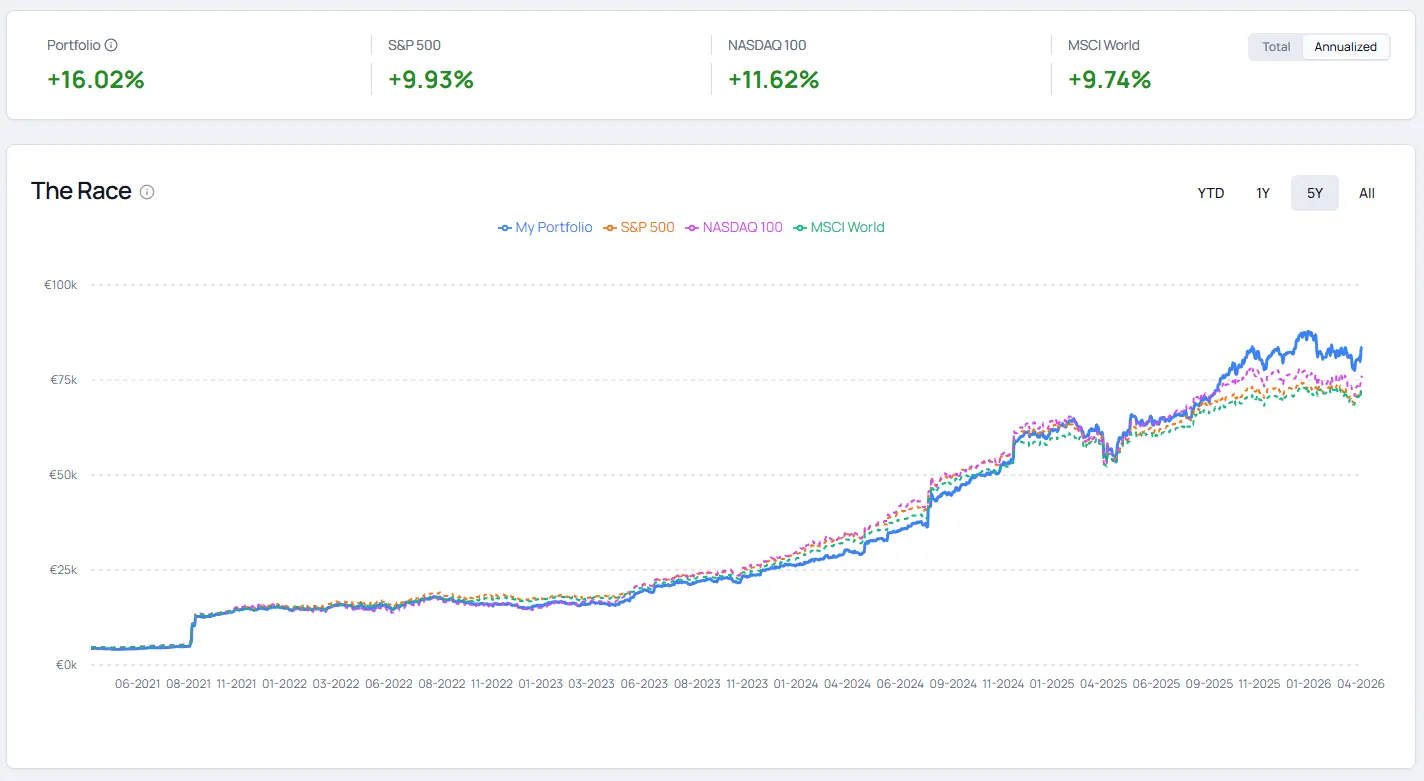
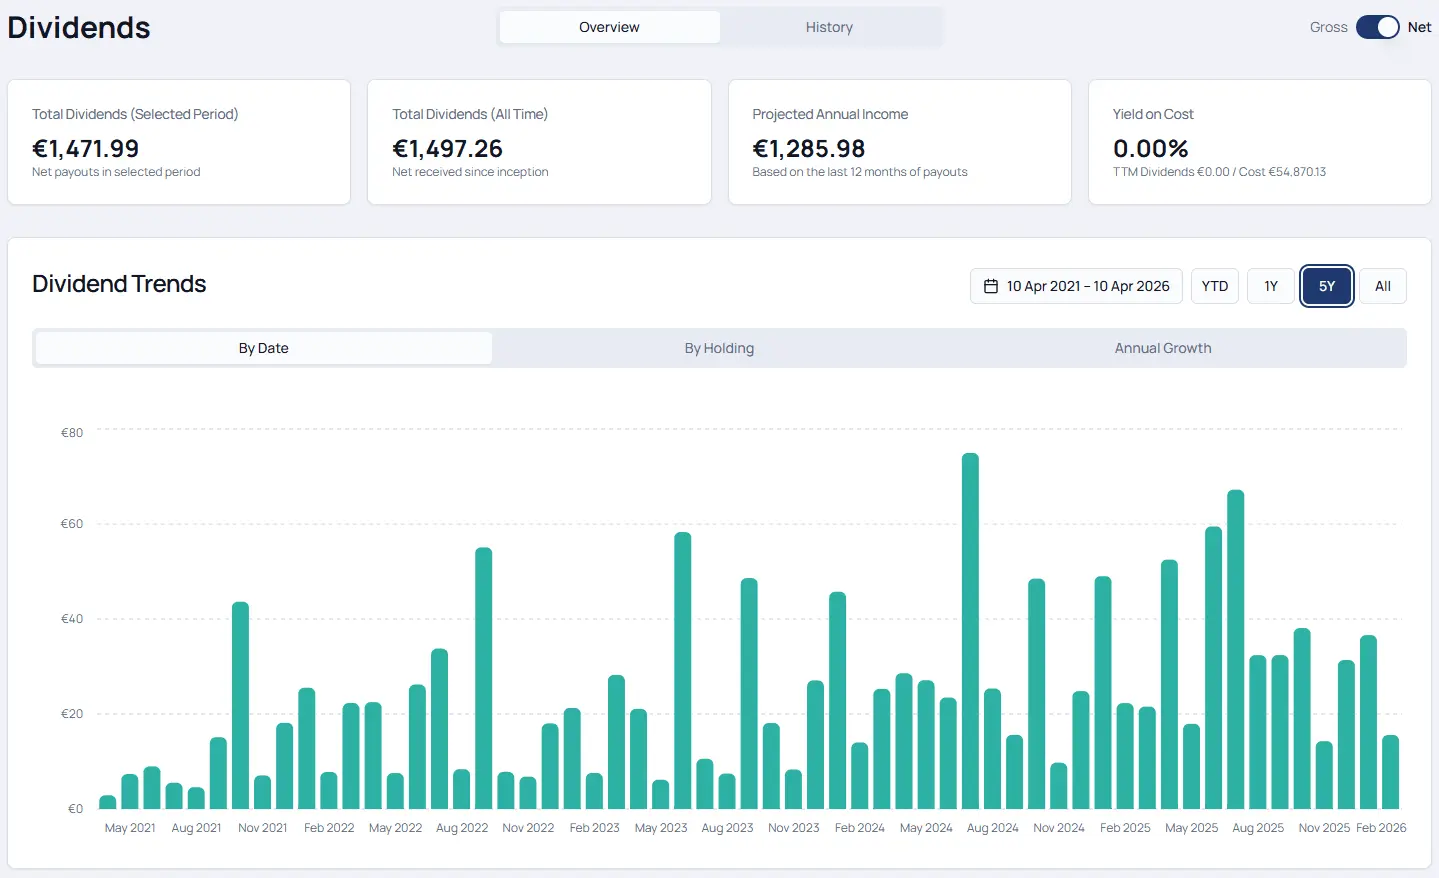
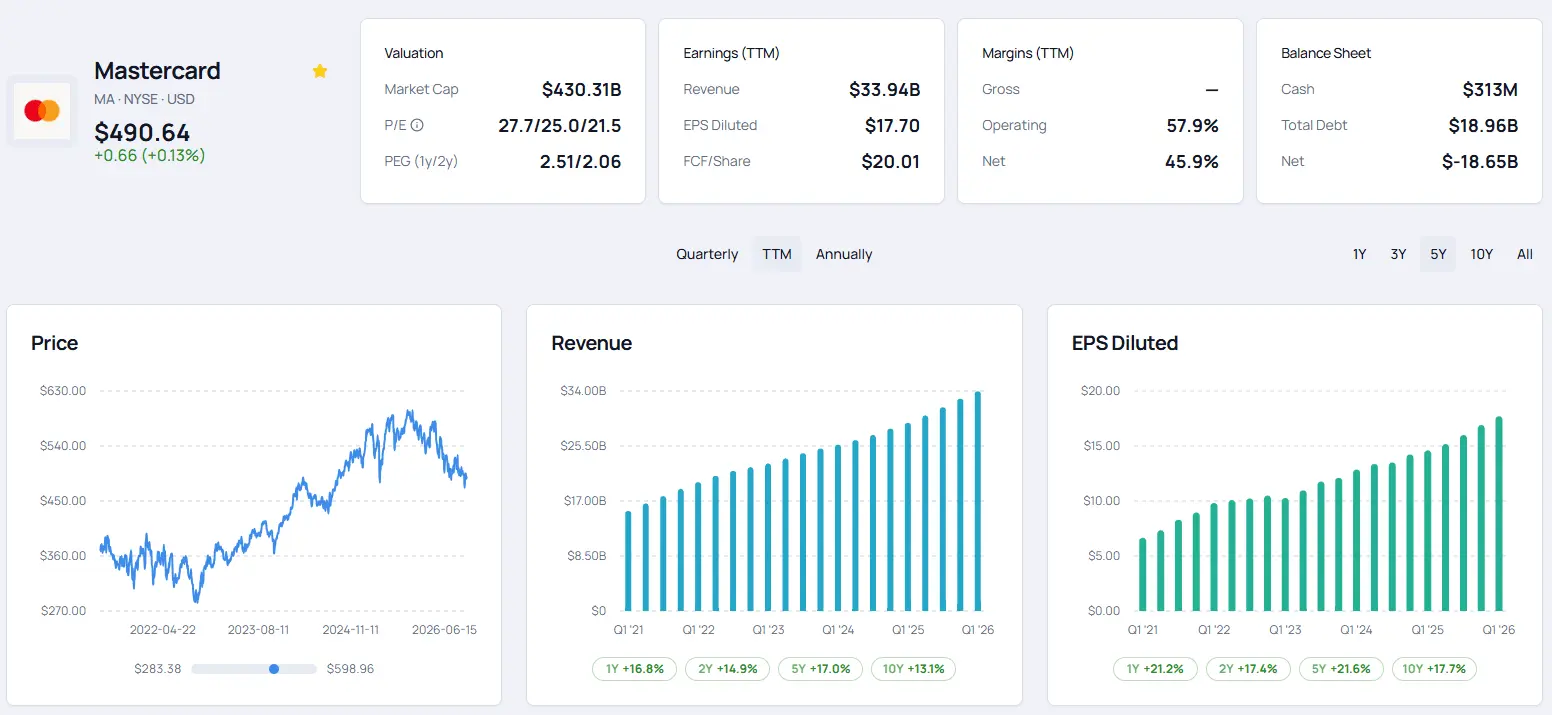
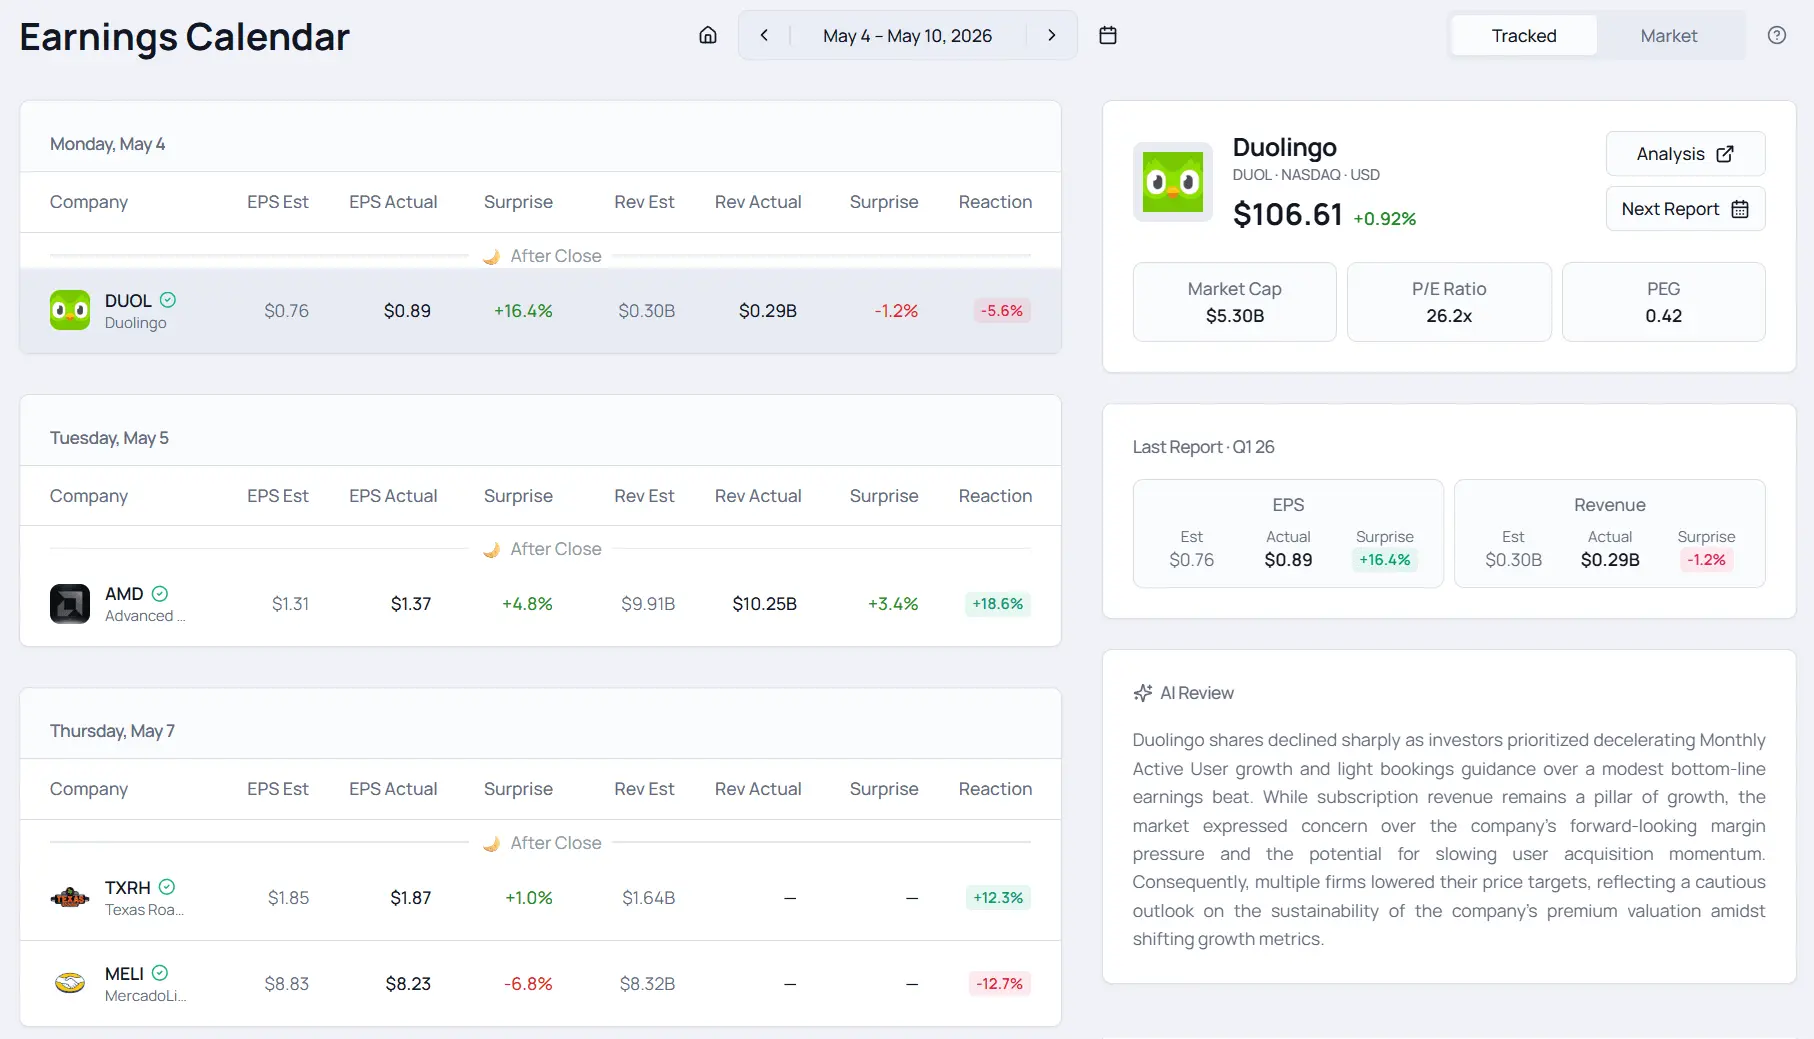
Oitava bridges the gap between tracking your investment returns and researching your stocks. It combines institutional-grade portfolio metrics (TWR, IRR, FIFO taxes and benchmark comparisons) with visual financial statements, earnings calendar, earnings transcripts including summaries and more. The goal is to stop using multiple apps for portfolio tracking, performance, financial news and stock fundamentals data sites. Oitava does all of these in a single, seamless, and private interface. 📈 Portfolio Mode: High-Fidelity Tracking • Multiple brokerage support: Trading 212, Trade Republic, DEGIRO, XTB, Interactive Brokers and Revolut • Connect directly to your Trading 212 account via API for automatic trade sync. • Import CSV statements from all the supported brokerages • Returns That Matter: View Time-Weighted Return (TWR) and Money-Weighted Return to see exactly how your portfolio is performing, isolating your stock choices from cash flow timing. • Benchmark Shadow Series: Compare your exact trade timing against indices like the S&P 500, NASDAQ 100, and MSCI World to see if you are truly beating the market. • FIFO Tax Calculator: Automatically compute your capital gains tax liabilities using FIFO lot netting, including tiered holding period rates and dividend withholding tax credits. Currently 10 countries are supported and we're expanding to more • Behavioral KPIs: Track your Win Rate, realized vs. unrealized profit splits, and average holding periods (winners vs. losers) to audit your trading discipline. 🔬 Analysis Mode: Deep Stock Research • Visual Fundamentals: Explore 16 visual financial charts spanning Trailing Twelve Months (TTM) and historical quarterly metrics: Revenue, EPS, Free Cash Flow, Margins, Cash vs. Debt, PE valuation over time and more. (limited to the S&P500 stocks for now. Expansion to more US and European stocks coming soon) • Earnings Calendar: Monitor upcoming earnings for your holdings or the wider market, complete with consensus analyst expectations, expected YoY growth, and pre-earnings expectations/post-earnings reactions. • Earnings Transcripts: Read full earnings call transcripts parsed by speaker, or review AI-powered summaries breaking down the call into executive highlights, segment performance, and analyst Q&A trackers. • Interactive Reverse DCF: Project stock valuations and compute margins of safety and implied growth rates for up to 3 stocks in a side-by-side comparison.
Screenshots
Reviews (0)
No reviews yet. Be the first to rate this product!
Comments (1)
Hey! Tired of switching between trackers & research tools? I built Oitava for myself to solve that problem, and now I'm sharing it! Free early access - I'd love your feedback!