SmartPlot
Modern scientific plotting and data analysis software

Details
- Follow on
- @Boleon10
- Target Audience
- ResearchersAcademicsStudents
- Pricing
- Freemium from $8
Discovery signals
How AI and people discover SmartPlot on PeerPush
By AI reads among Writing & Documentation tools
616 AI reads in the last 30 days, ranked against every Writing & Documentation tool listed.About SmartPlot
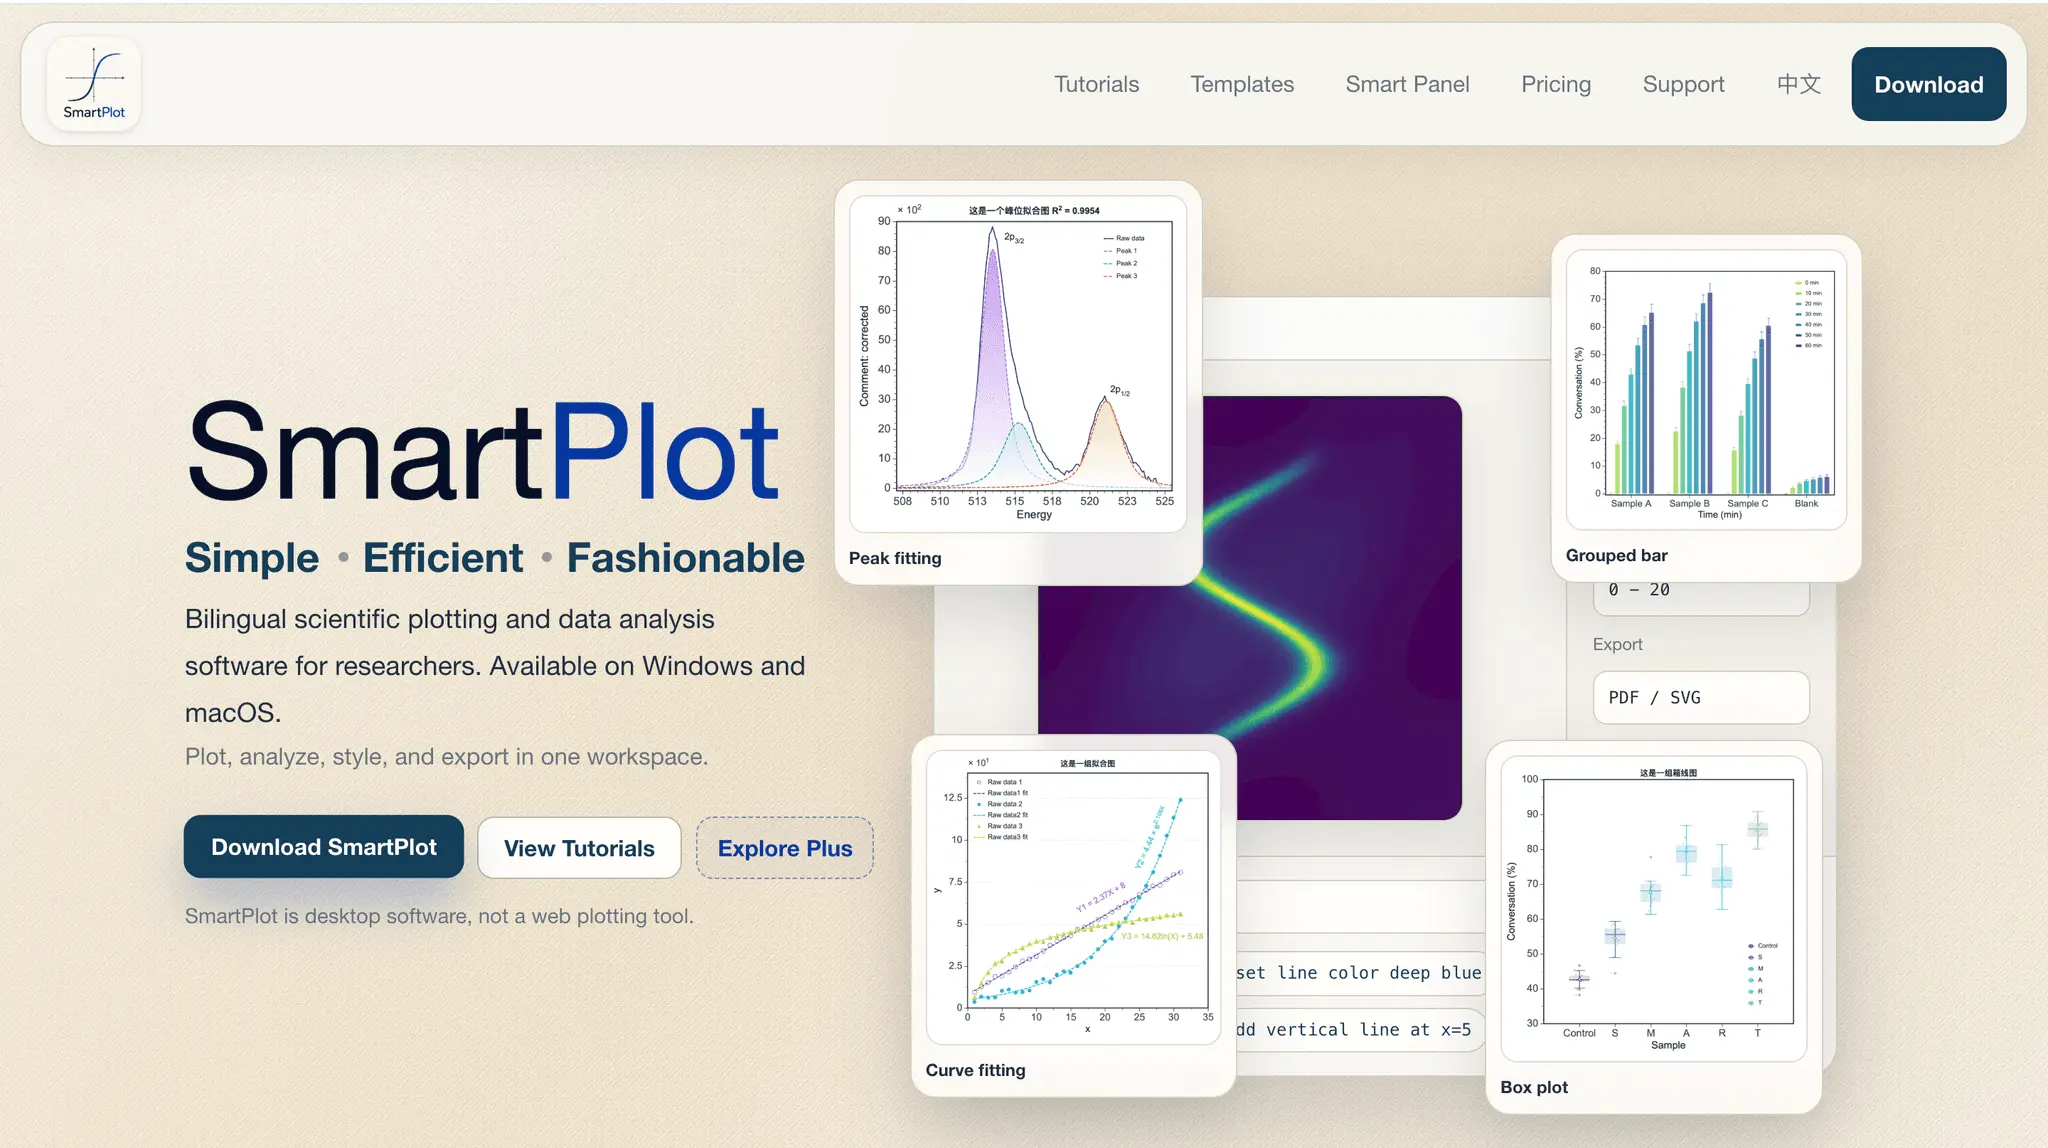
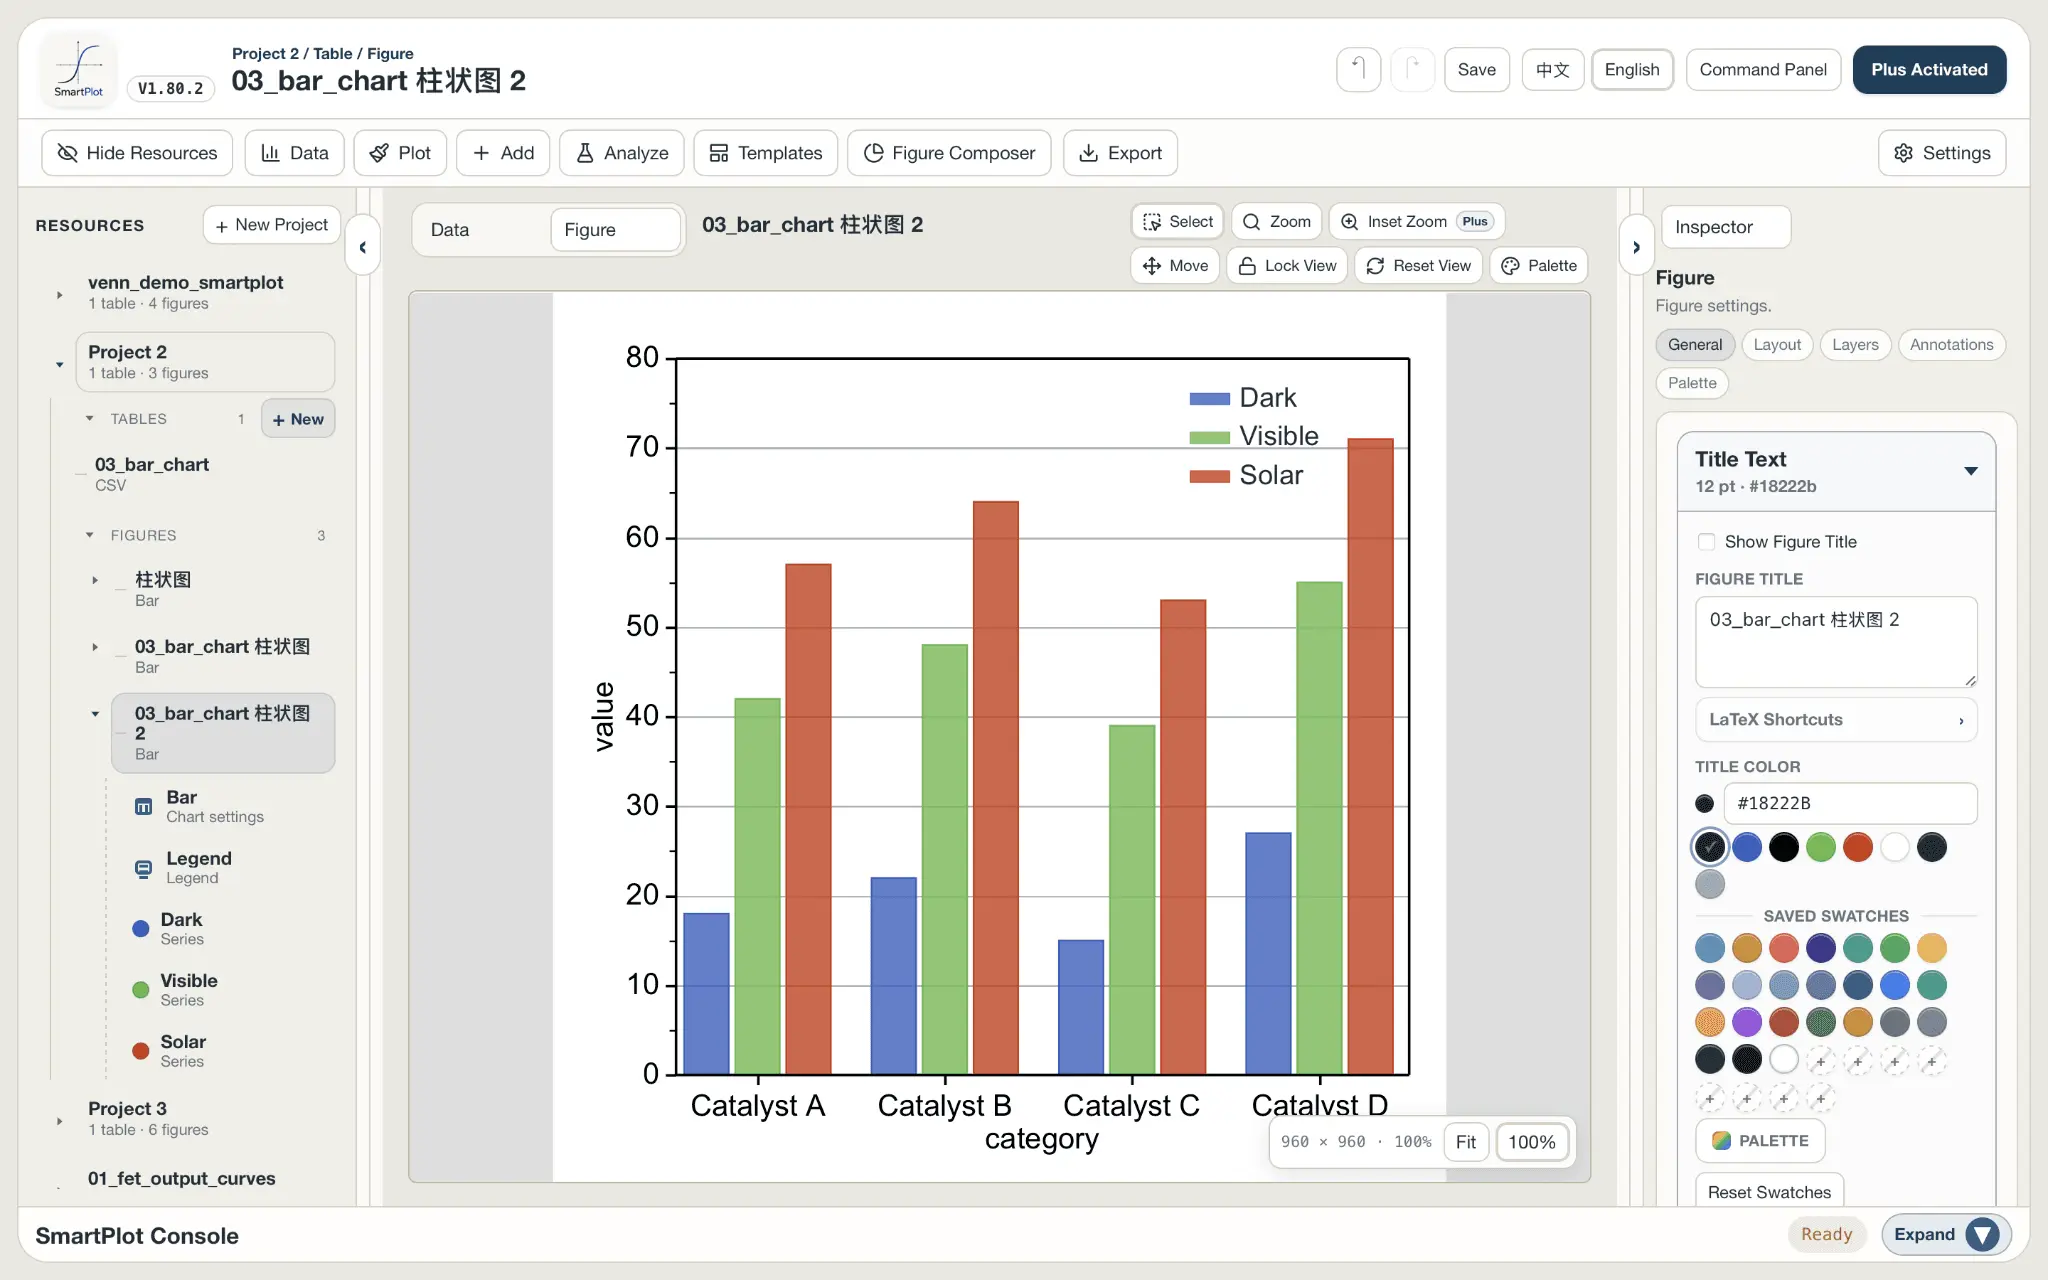
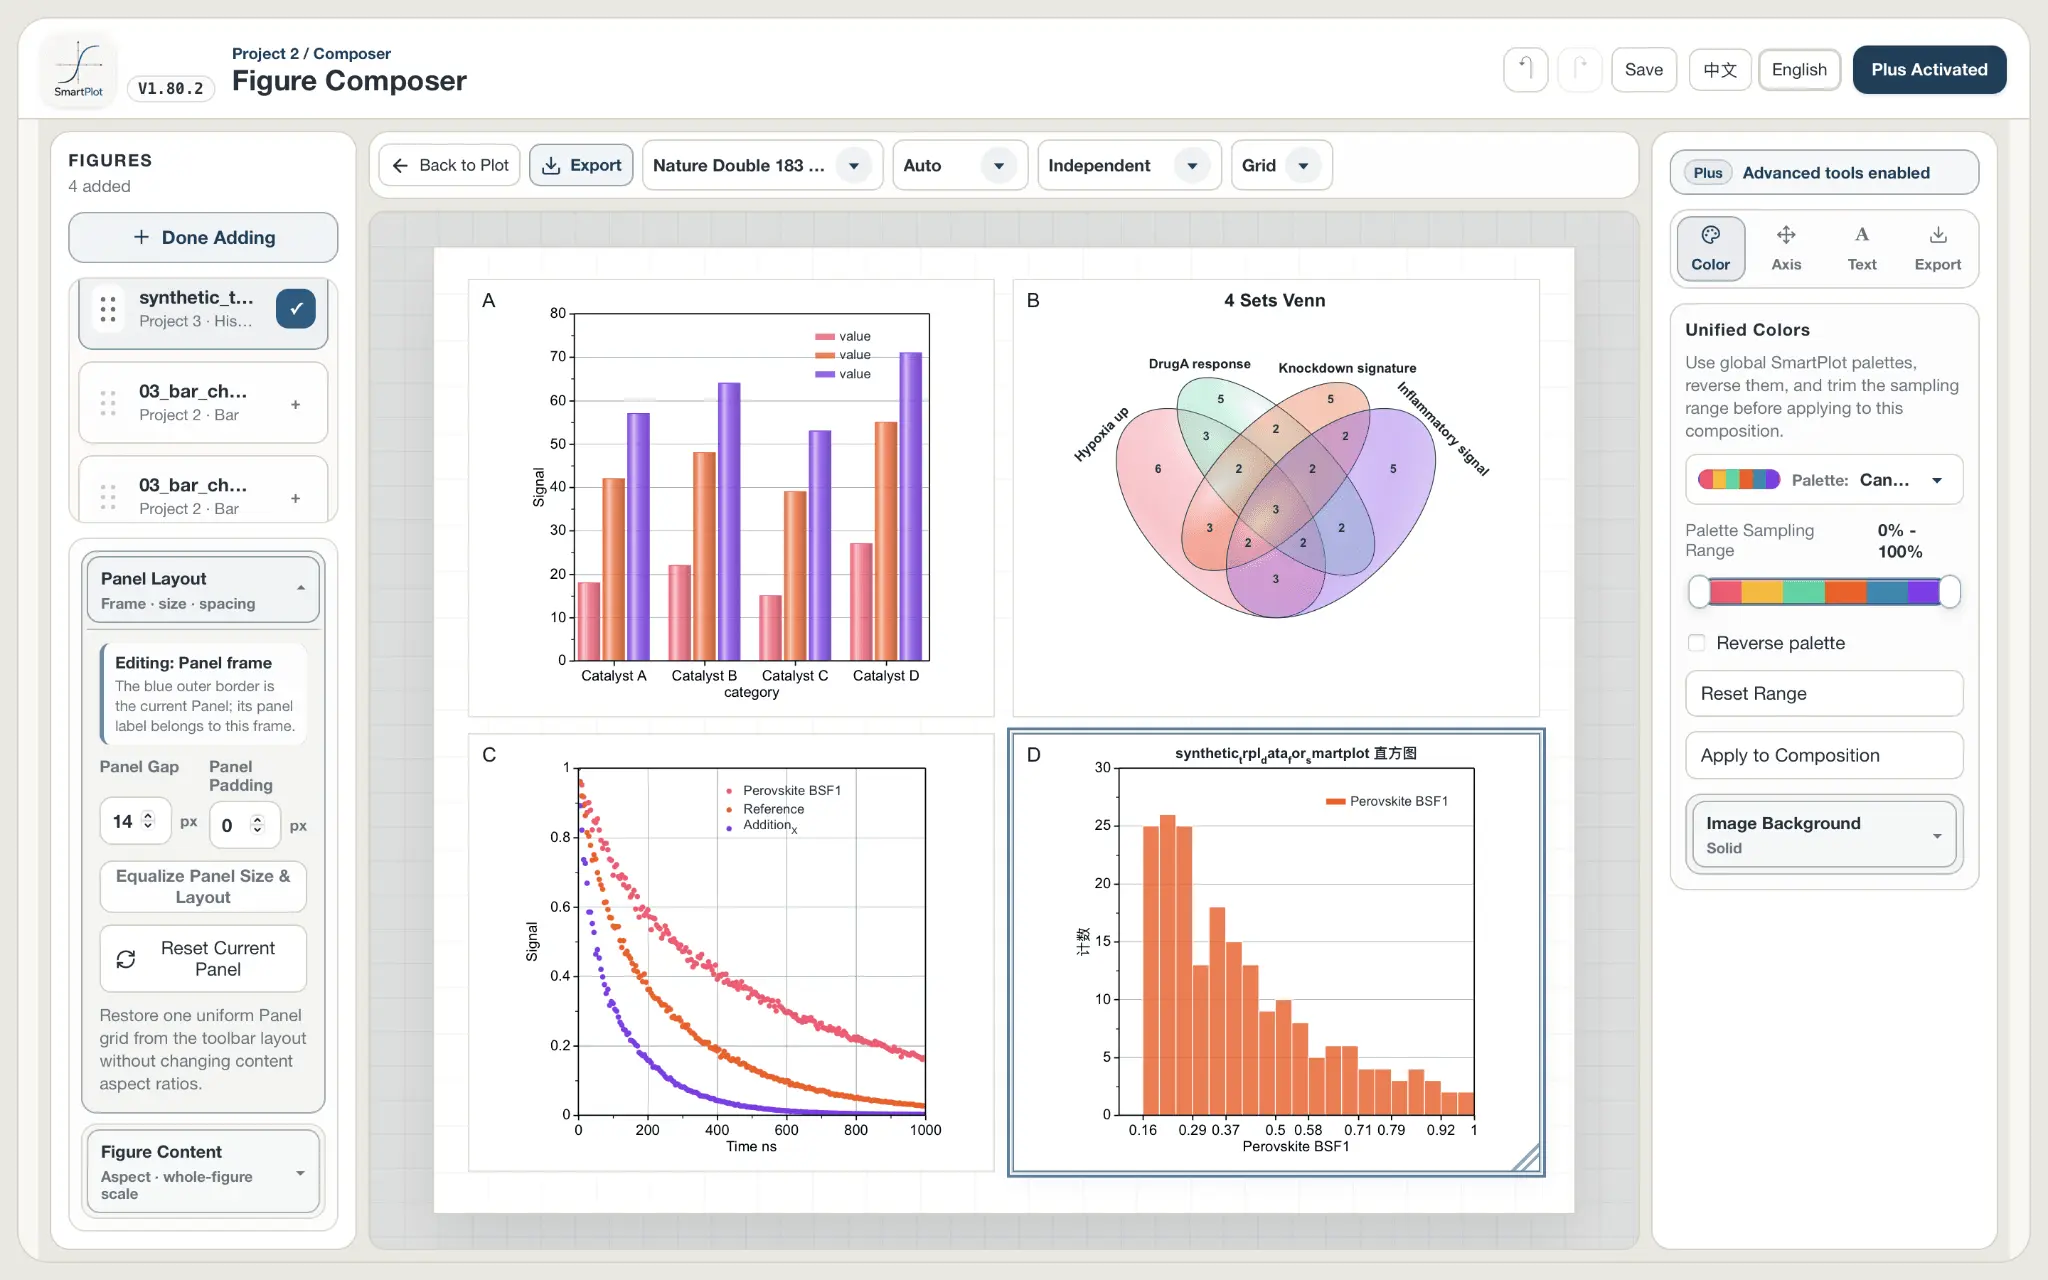
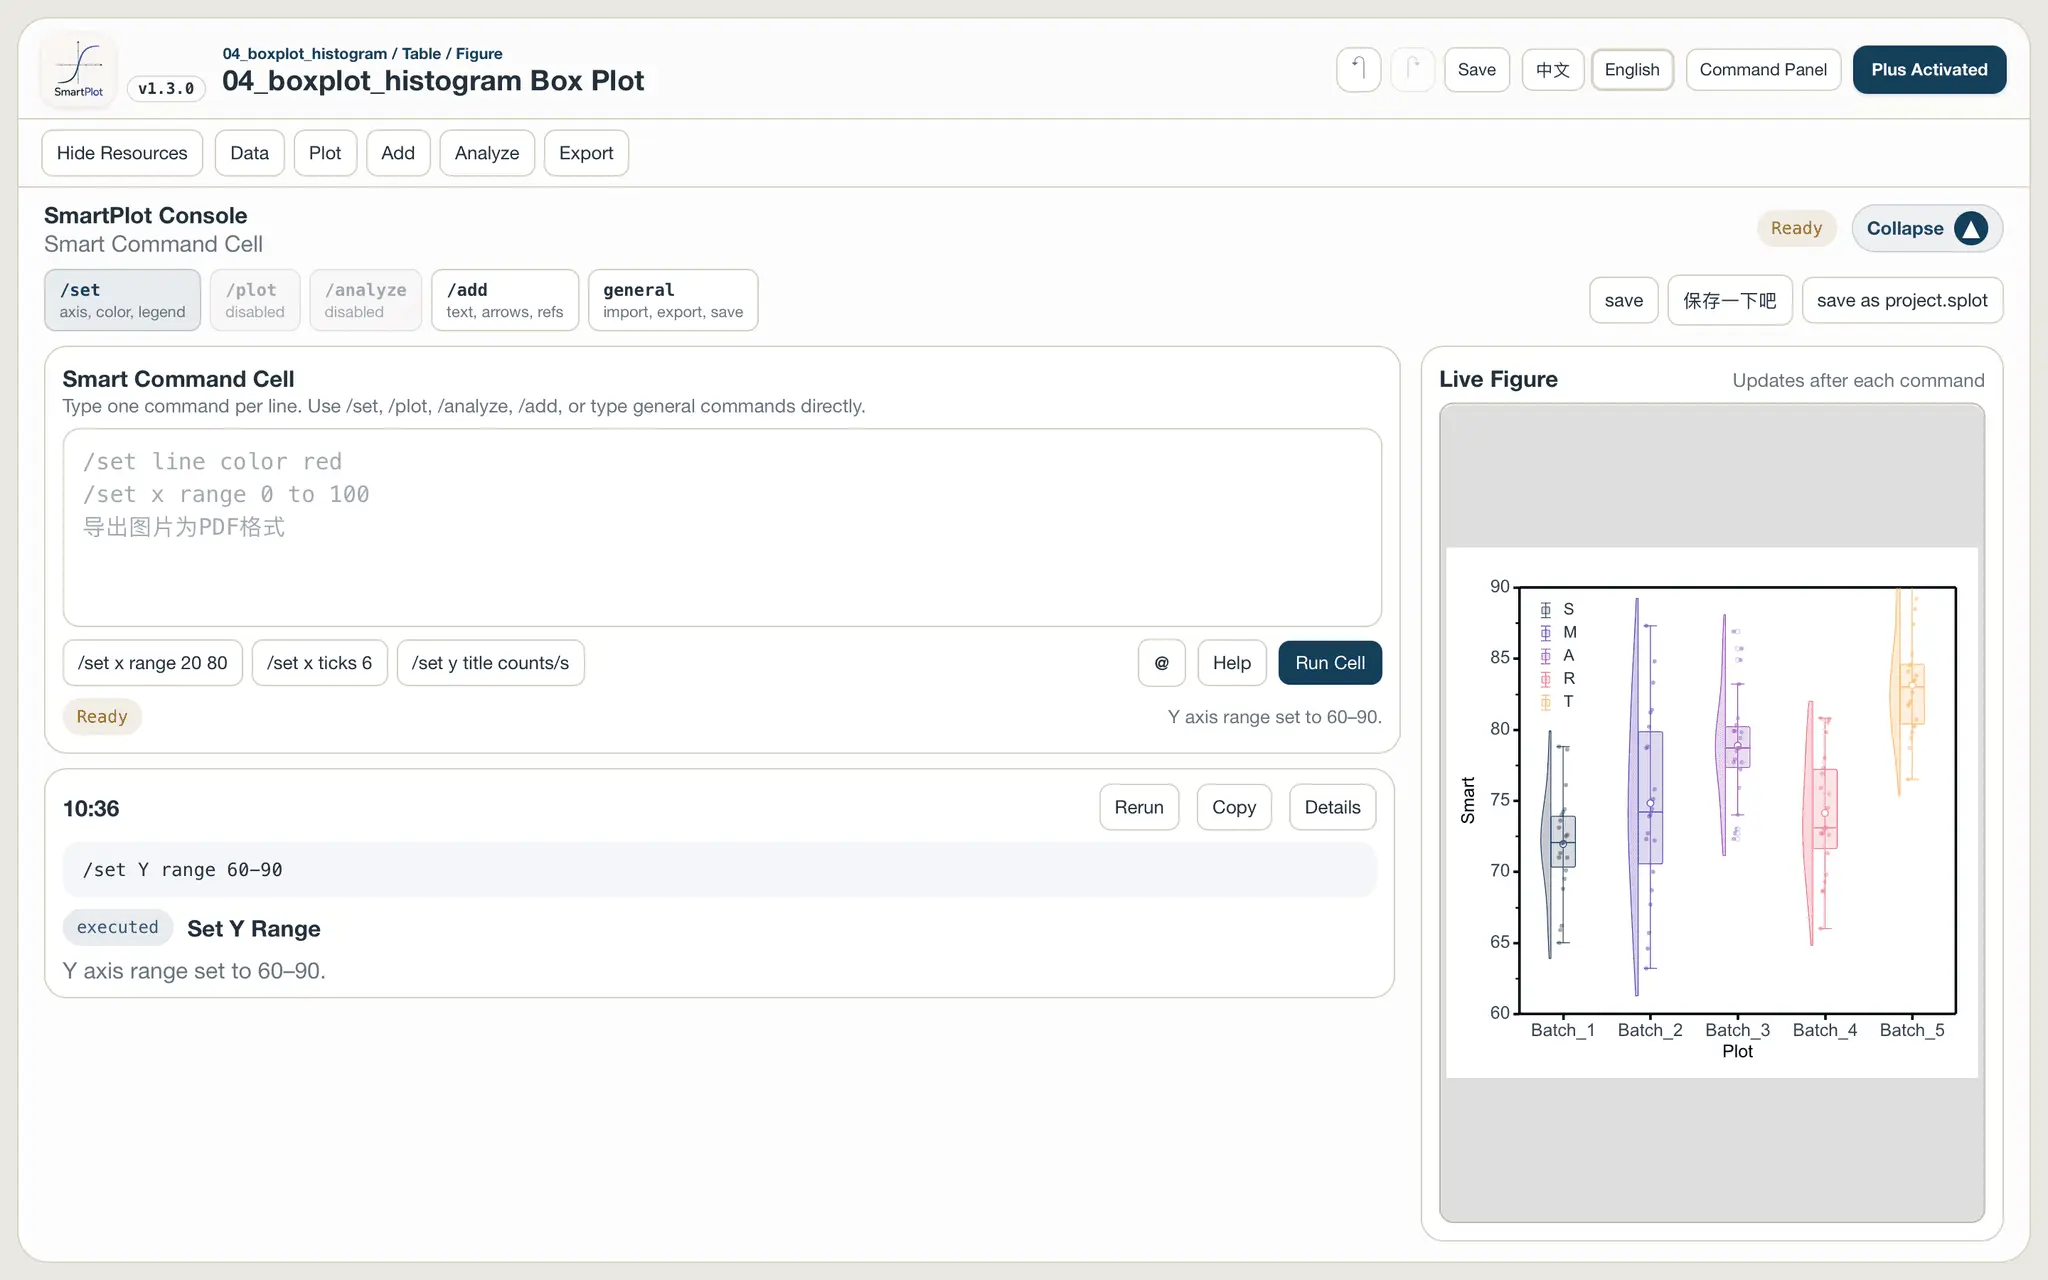
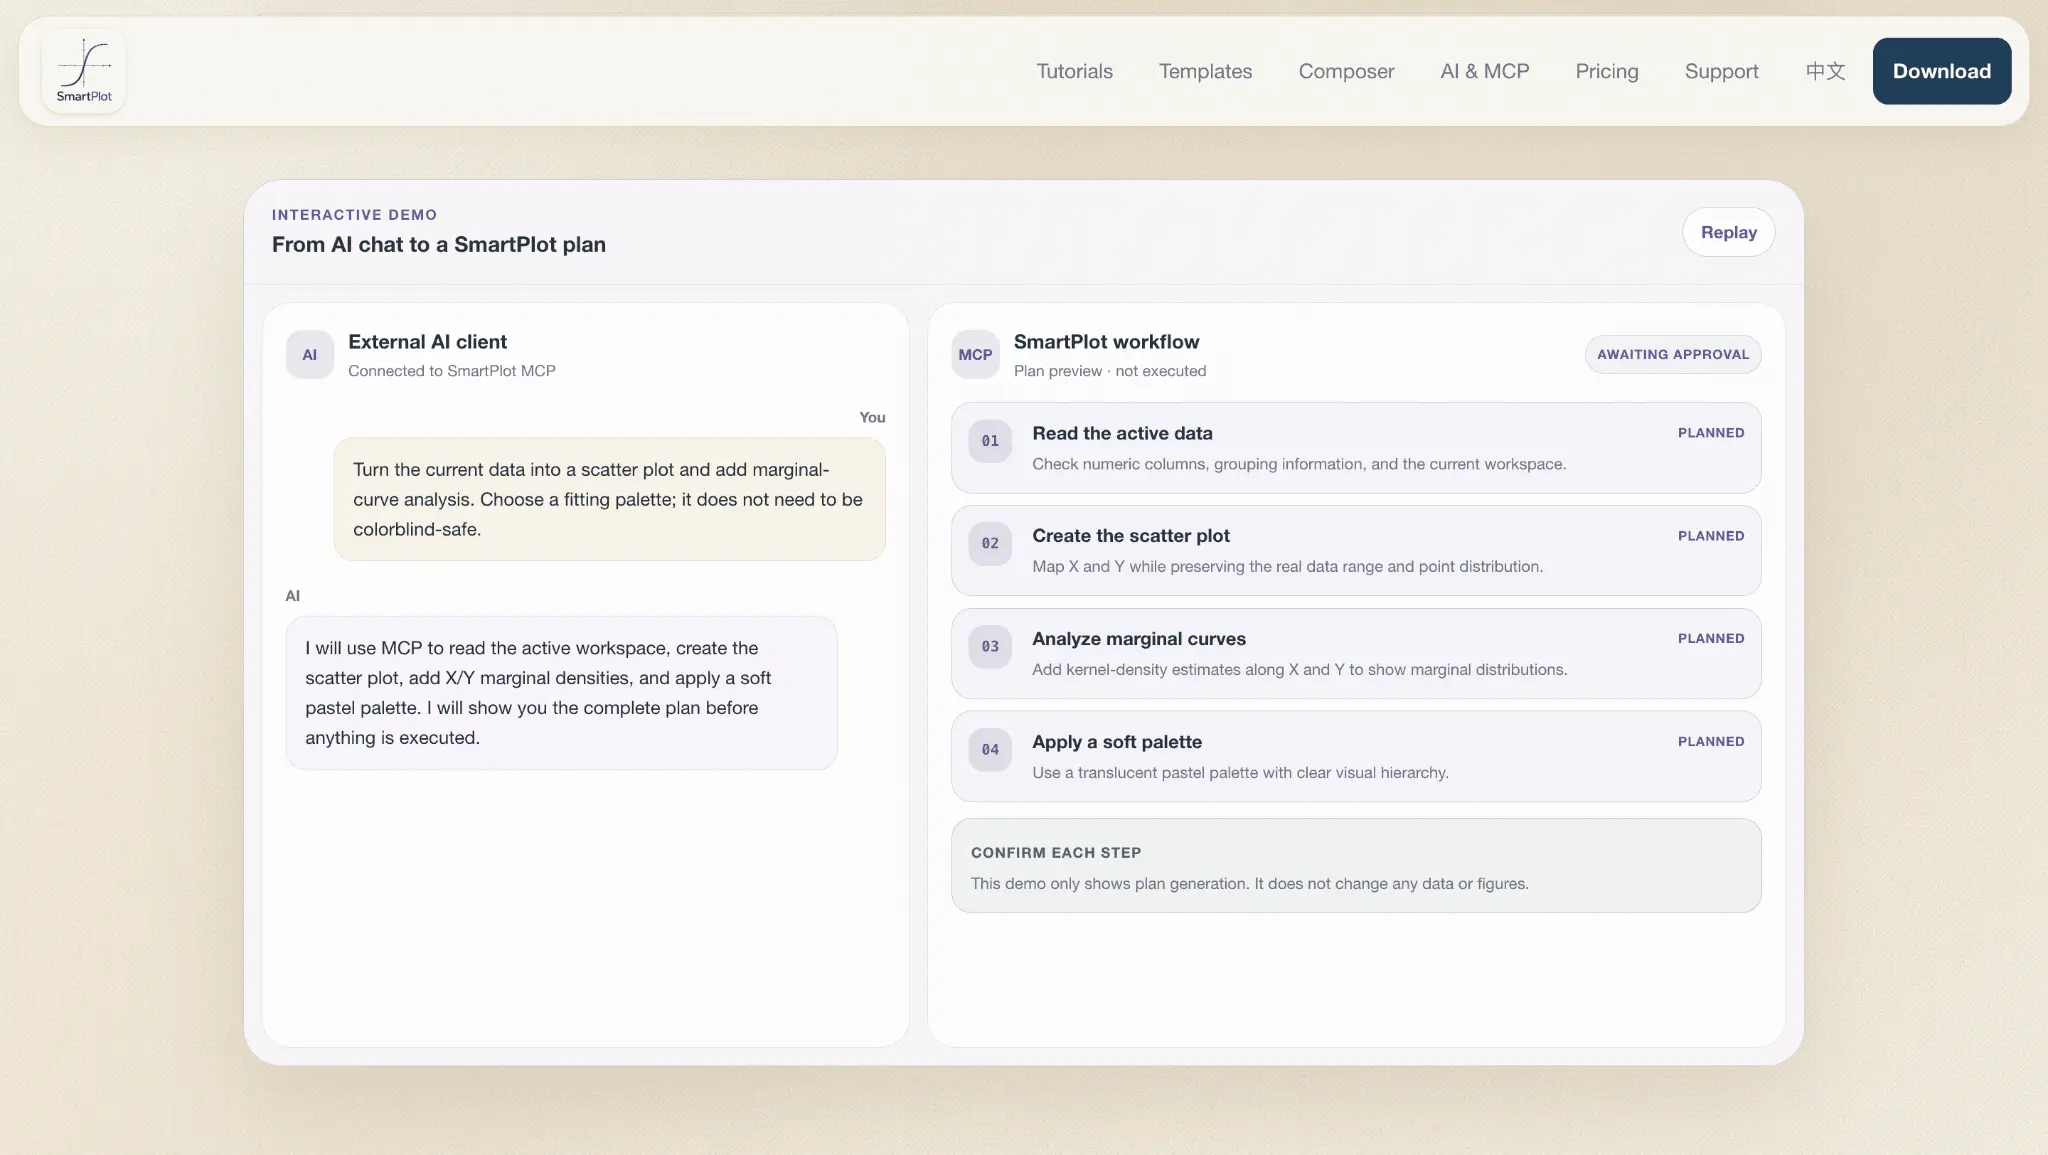
SmartPlot is a desktop scientific plotting and data analysis tool built for researchers. It provides a modern workflow for creating, analyzing, styling, combining, and exporting publication-ready scientific figures. SmartPlot supports common scientific charts including line, scatter, bar, box, heatmap, bubble, radar, and more, together with curve fitting, peak fitting, multi-panel figure composition, customizable color palettes, annotations, and scientific export formats such as SVG, PDF, PPTX, and TIFF. It runs on Windows and macOS, with Linux currently available in Beta, and supports both English and Chinese interfaces. SmartPlot is also exploring AI-assisted scientific plotting through MCP. Instead of generating static scientific images, compatible AI clients can understand the actual plotting workspace and help create or modify editable charts and plotting workflows. SmartPlot offers a free version for everyday scientific plotting, with an optional Plus upgrade for additional features.
Product Video
Watch a video demo of SmartPlot.
Screenshots
Product Updates (1)
SmartPlot V1.85 — New plots and reusable research workflows
SmartPlot V1.85 is now available. This release adds two new plot types and makes repeated analysis workflows much easier to reuse: • Pie & donut charts with category aggregation, flexible labels, leader lines, and optional 3D presentation • Lollipop plots with vertical / horizontal layouts, configurable baselines, markers, labels, and error bars • Reusable workflow templates that record successful analysis steps, parameters, semantic inputs, and data lineage for replay on new datasets • Function reference lines defined directly from mathematical expressions • Improved axis labels, display-only units, error-bar batch styling, and figure rendering around axis boundaries The workflow templates are especially important for us: SmartPlot records operations and parameters only — never screen, video, or audio — and saved workflows can also be used through the guarded MCP workflow. Full changelog: https://smartplot.app/changelog
Comments (0)
No comments yet. Be the first to share your thoughts!
Reviews (0)

Comments (2)
@difoke1464 Thx
Built by researchers for everyday scientific plotting. We’re exploring a simpler desktop workflow and editable AI-assisted plotting through MCP. Feedback is very welcome!