
ChartKit
Consulting-grade charts, natively in Google Slides

Details
- Categories
- Use Cases
- Target Audience
- Pricing
- Freemium
- Platforms
Discovery signals
How AI and people discover ChartKit on PeerPush
About ChartKit
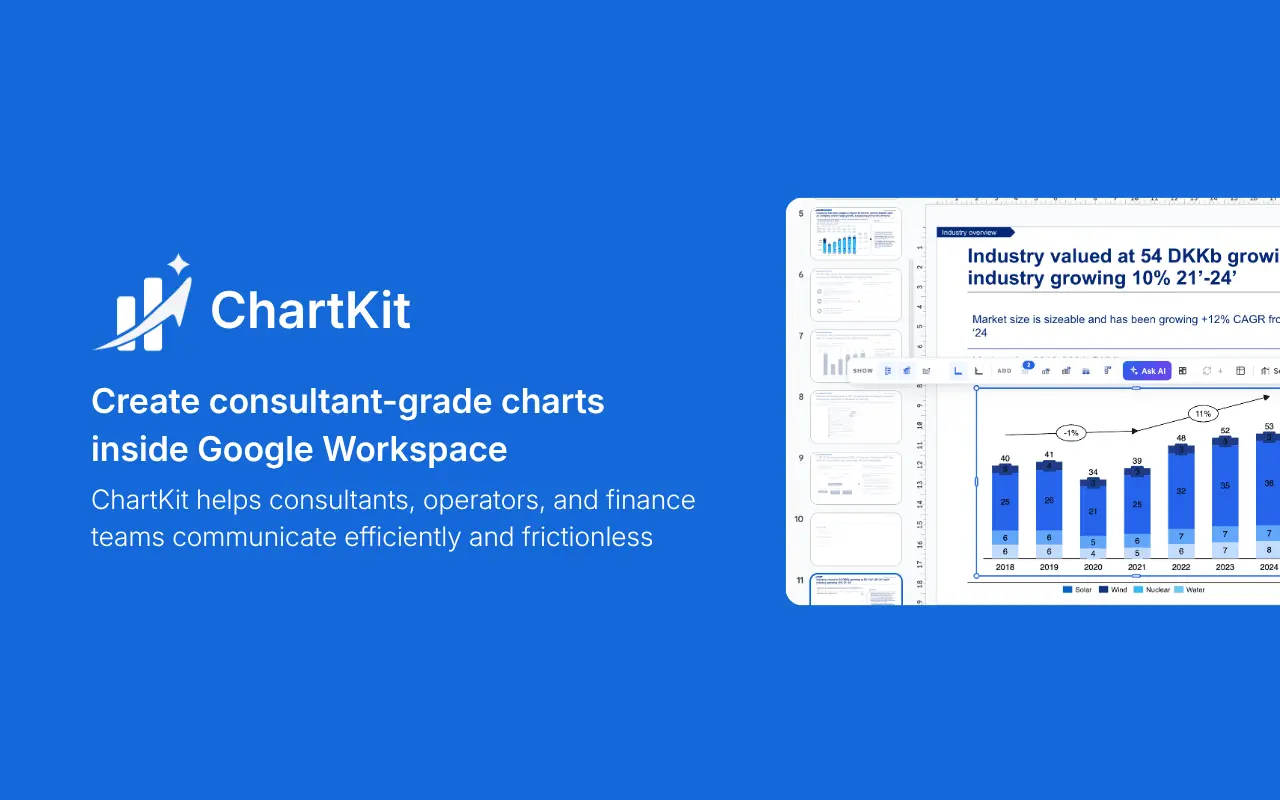
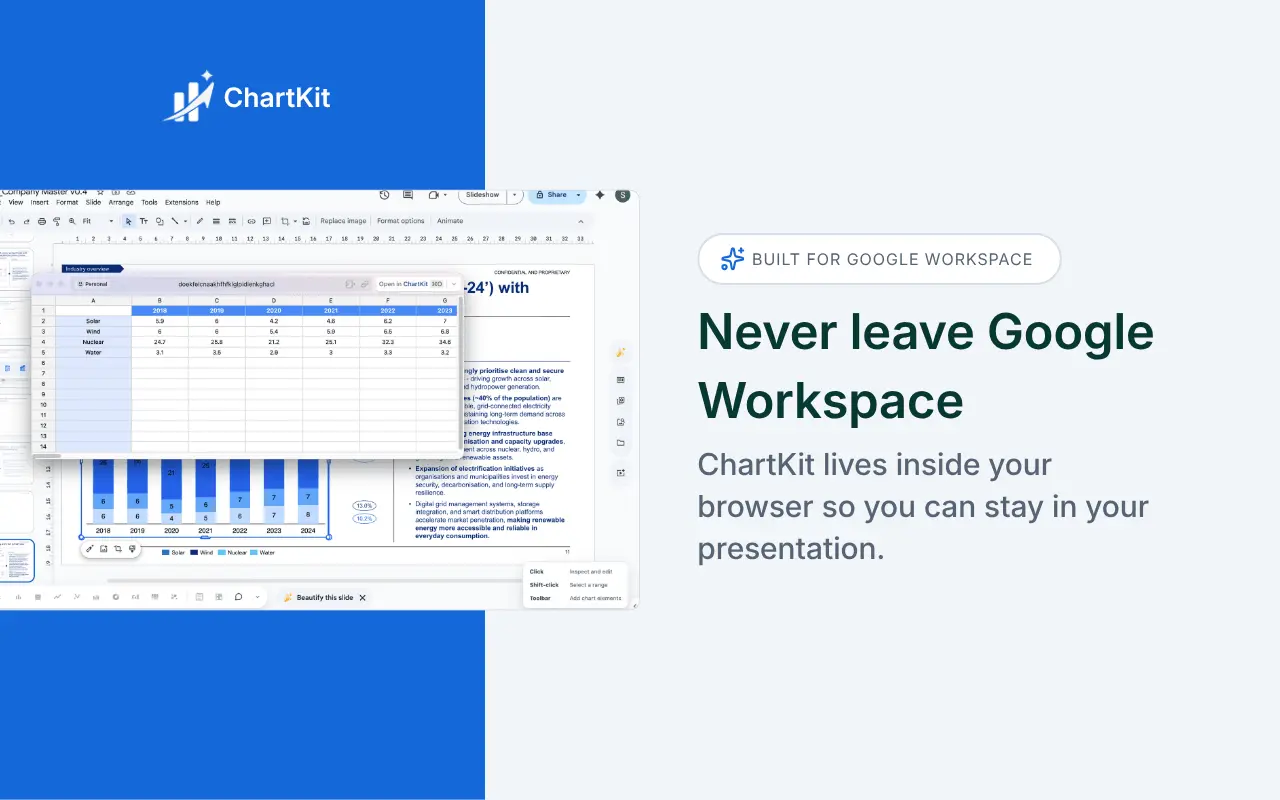
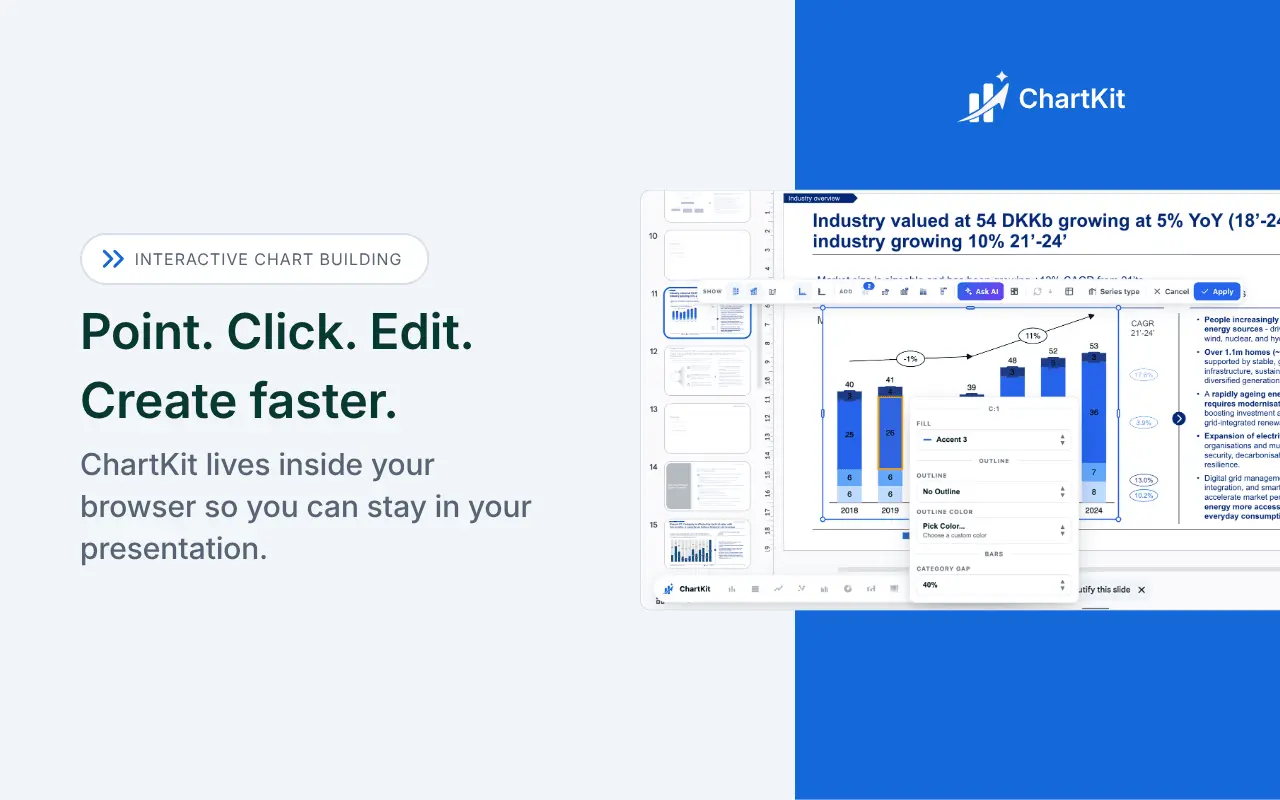
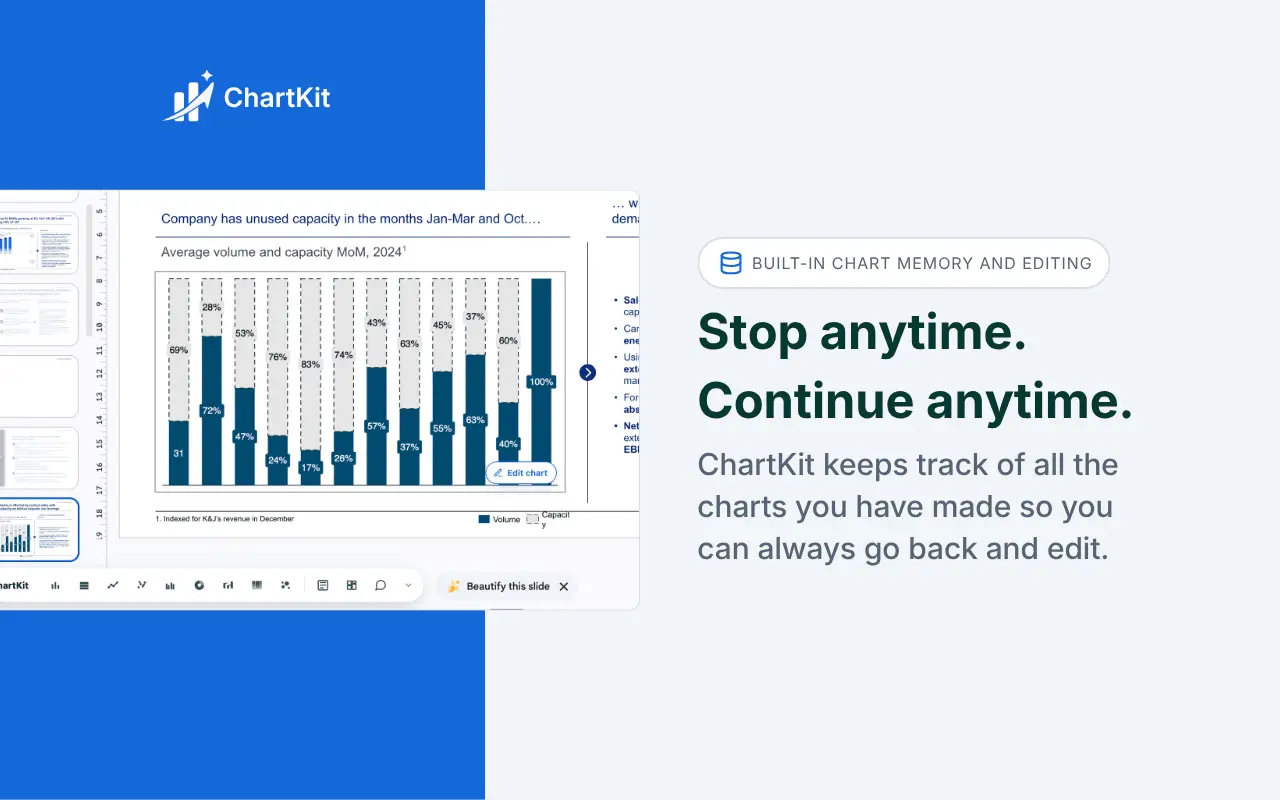
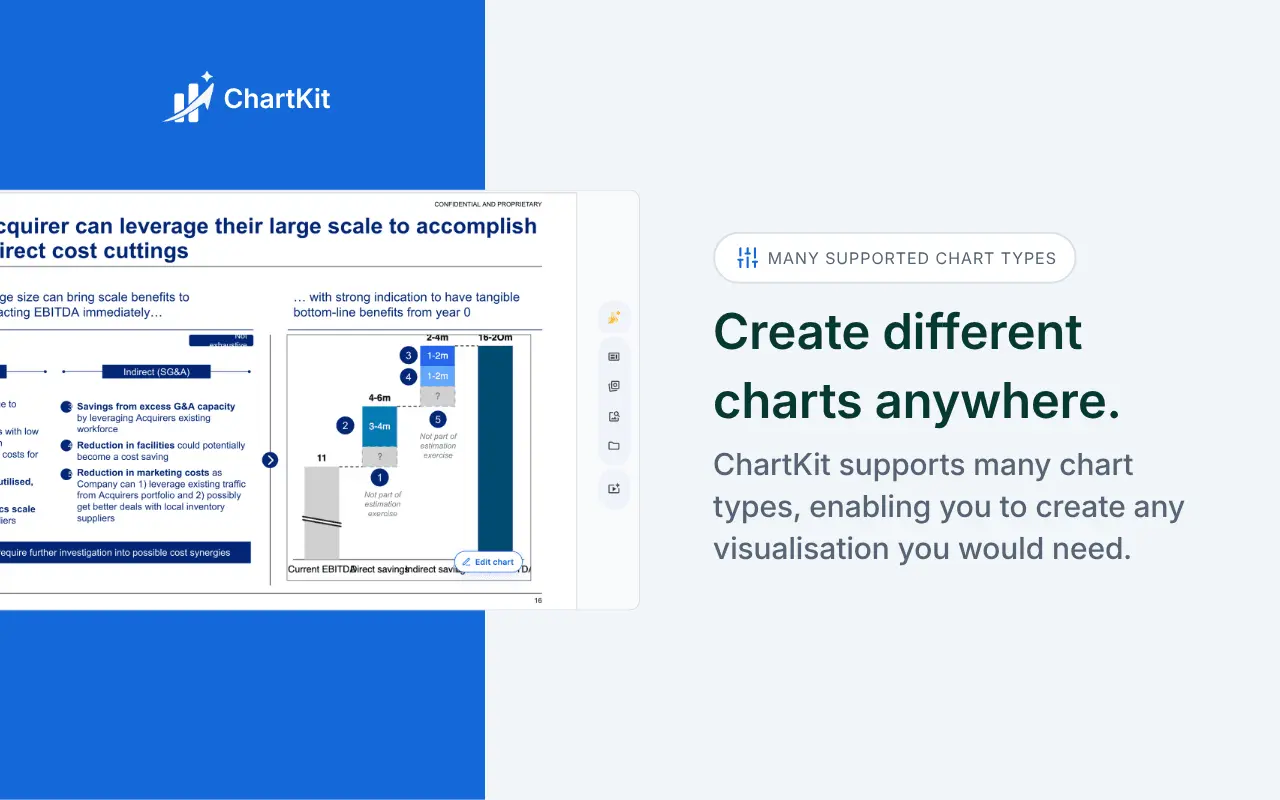
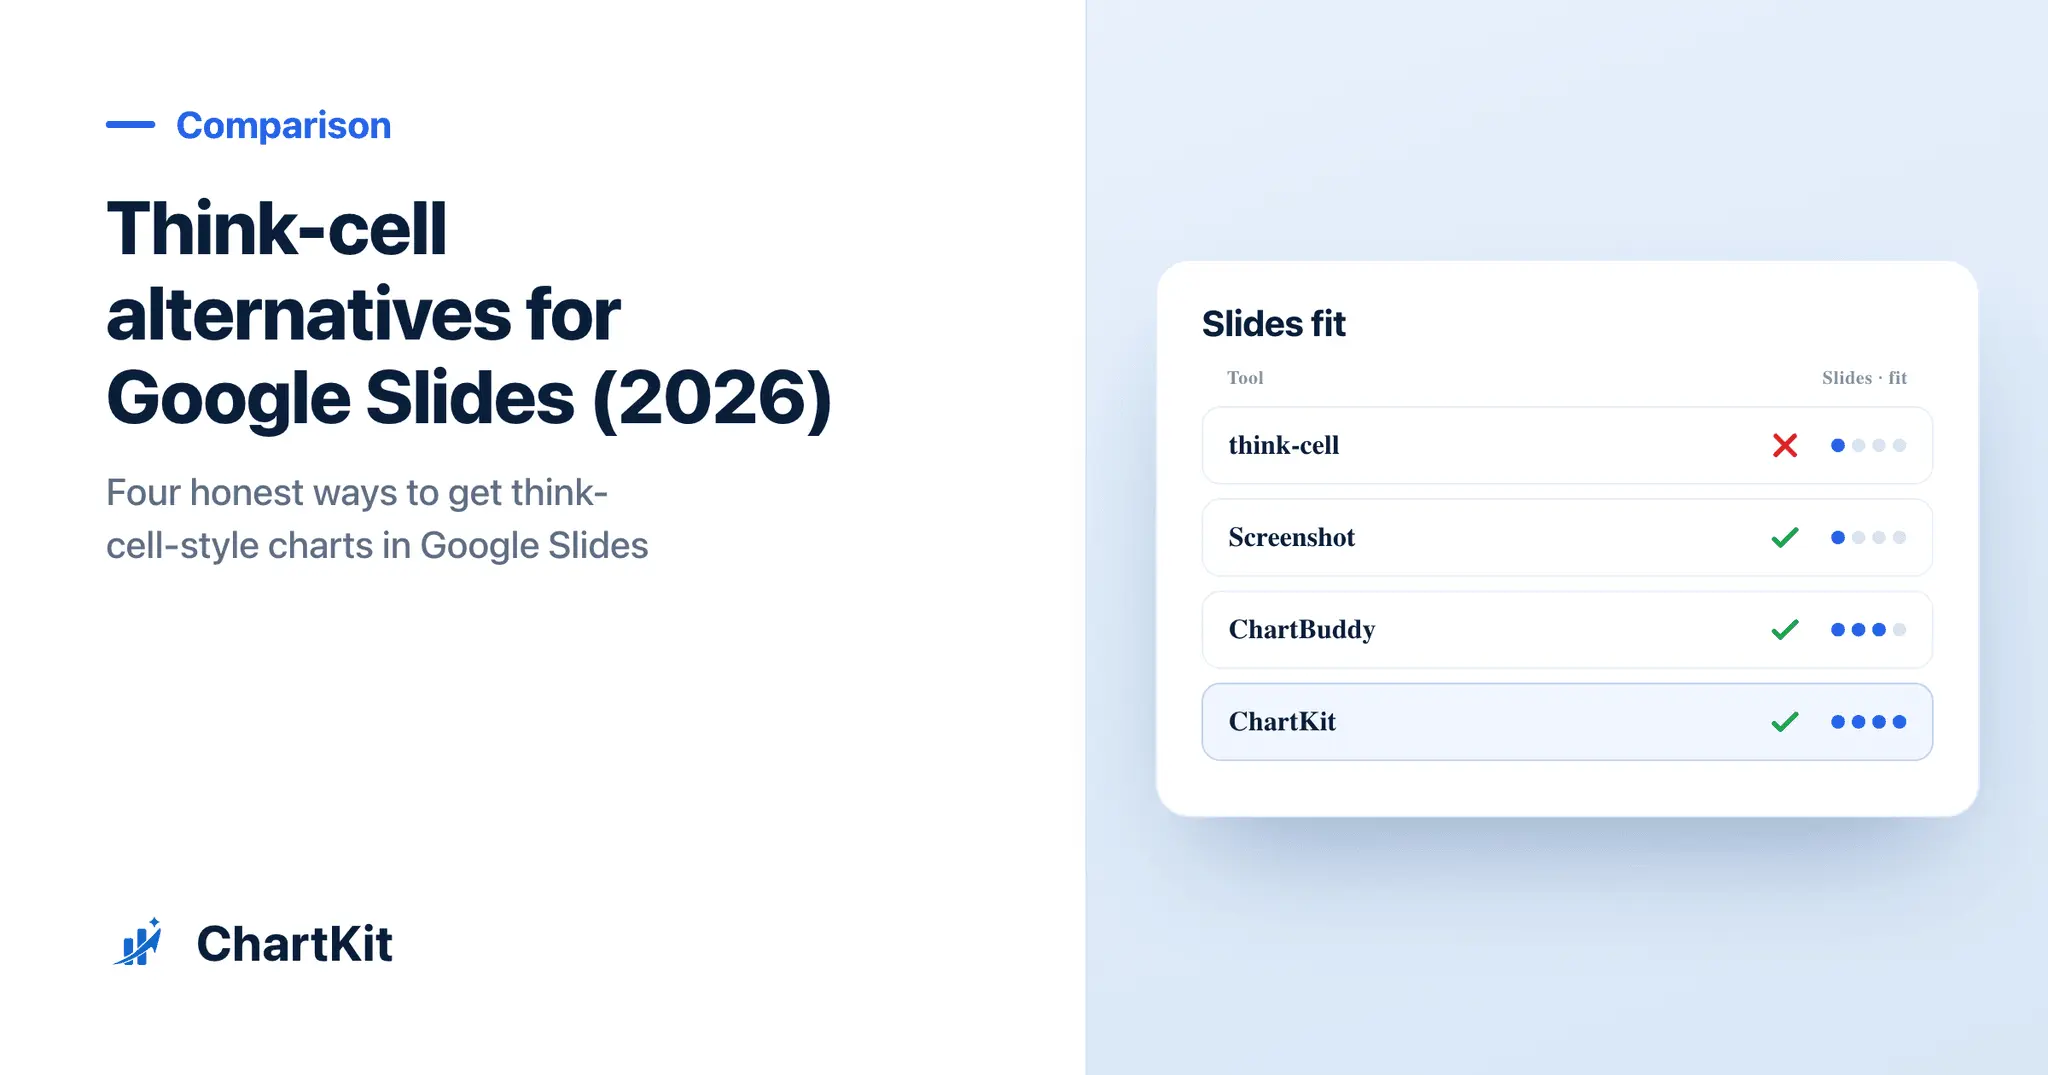
ChartKit is a Chrome extension that builds consultant-grade charts — waterfalls, stacked bars, 100% bars, line charts — directly inside Google Slides, Docs and Sheets. It's a native think-cell alternative for the large cohort of ex-consultants and FP&A/BizOps teams who moved to Google Workspace and lost their charting tool: the official think-cell workaround for Slides is to build the chart in PowerPoint and screenshot it every time the data changes. ChartKit removes that loop — waterfall/variance-bridge and stacked-bar charts that stay editable on the slide, with totals, deltas, annotations and axis breaks built in, live-linked to Google Sheets. Free tier (5 charts/mo); Pro €8/mo or €50/yr.
Screenshots
Reviews (0)
No reviews yet. Be the first to rate this product!
Comments (2)
Editable waterfall charts linked to Sheets would remove a lot of screenshot maintenance. When the source data refreshes, do manually positioned deltas and annotations keep their layout?
@GeneralManager_Getatext They do. All annotations are linked to a position that dynamically refresh with the data. You can try it out live here: https://www.getchartkit.app/charts/waterfall-chart
Built ChartKit after moving from PowerPoint to Google Slides and losing think-cell overnight. Waterfalls, stacked bars and variance bridges that stay editable on the slide, live-linked to Sheets.