
Graphium
Turn Excel charts into publication-ready visuals
@fatboyinpyjamas
Details
- Follow on
- @graphiumapp
- Target Audience
- ConsultantsData ScientistsNon-Technical Users
About Graphium
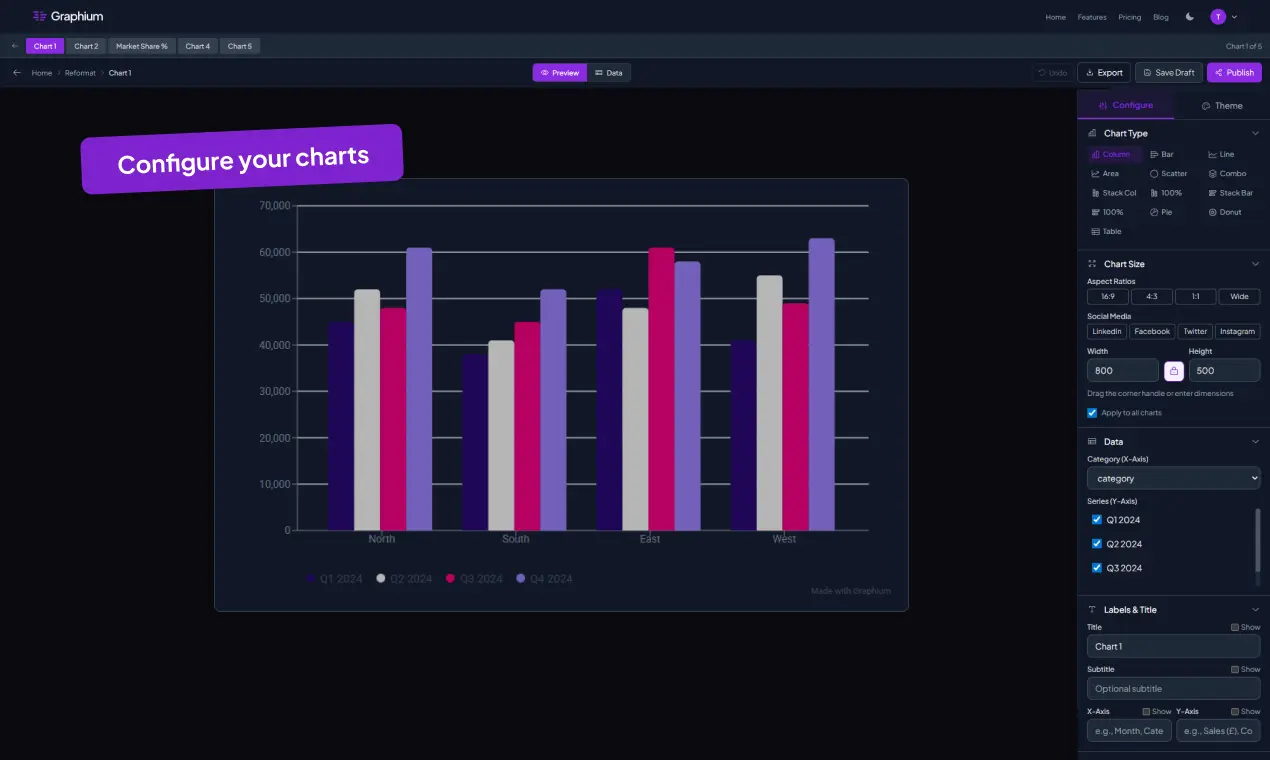
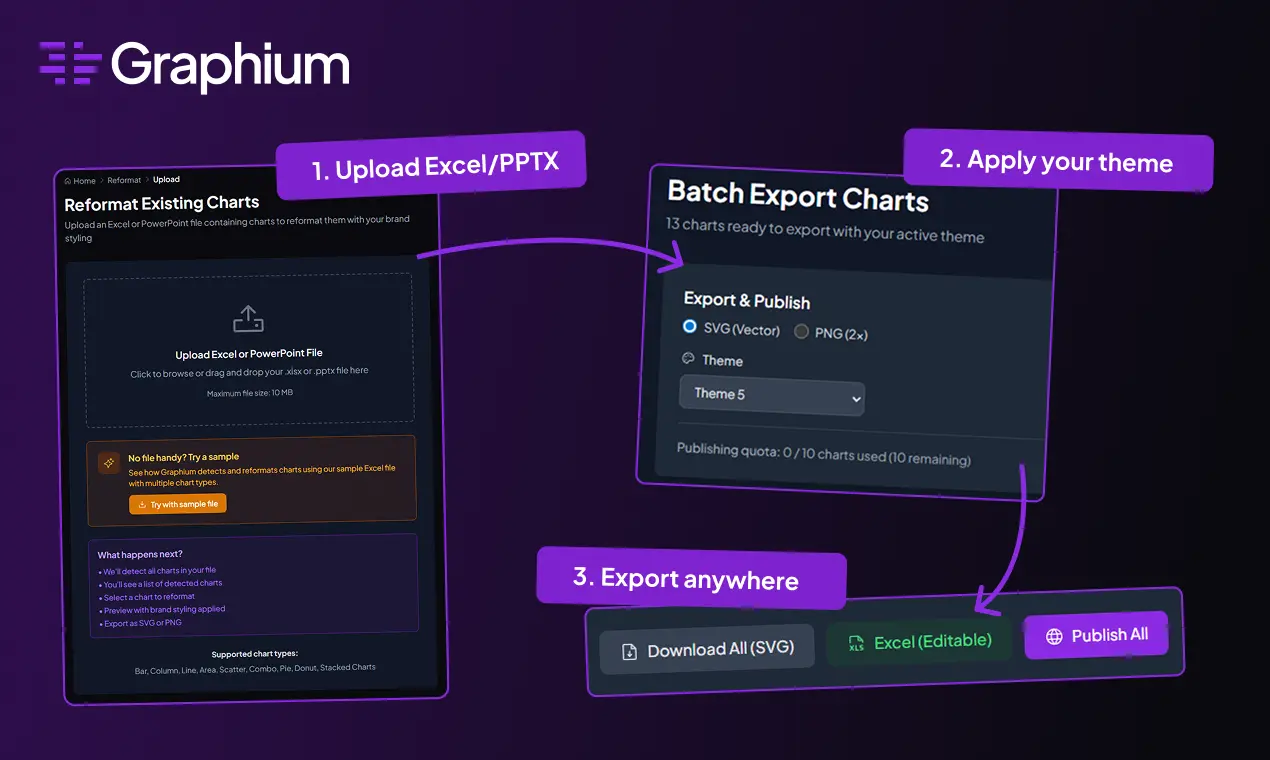
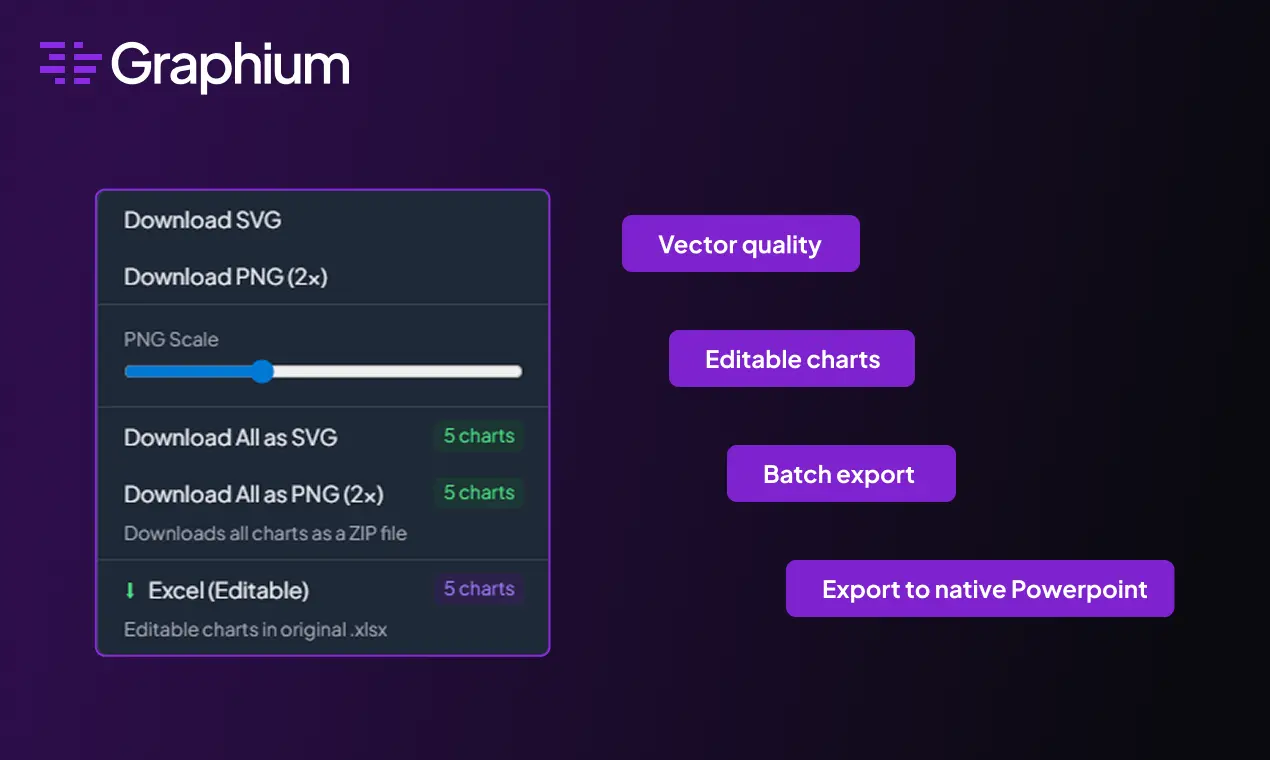
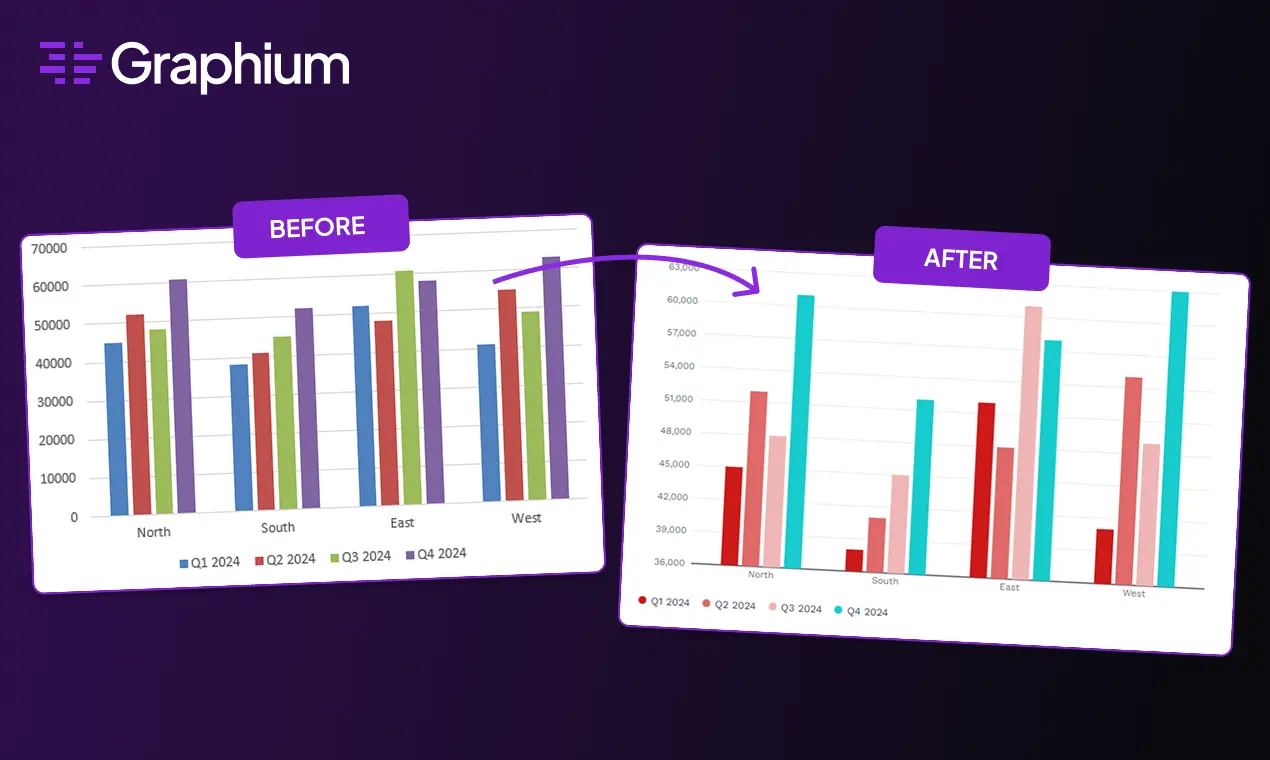
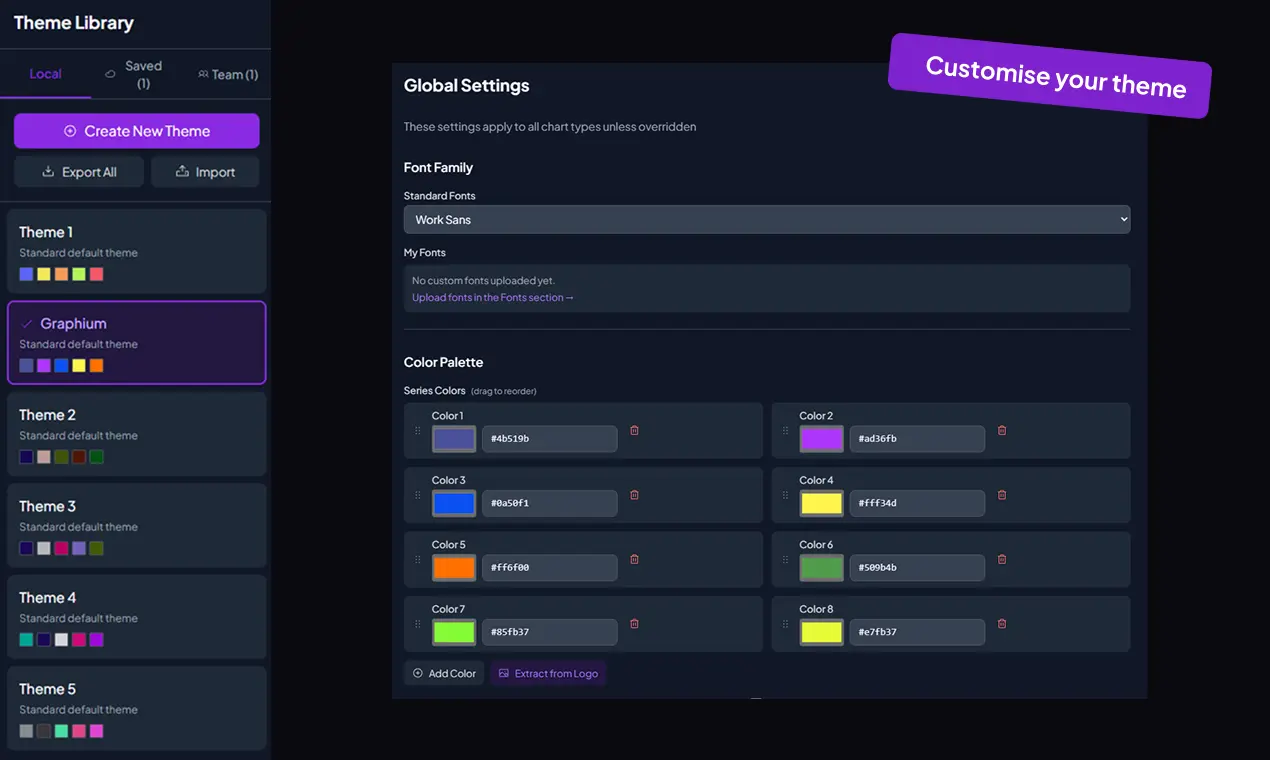
Graphium helps you transform your standard Excel charts into professional, publication-ready visuals. You can easily reformat your existing charts or build new ones from scratch using reusable brand themes. This tool ensures consistency across your data presentations by applying standardized design elements effortlessly. Whether you are preparing a report or a presentation, you can ensure your data looks polished and on-brand.
Screenshots
Reviews (0)
No reviews yet. Be the first to rate this product!
Comments (2)
Looks good 👍
Hey PeerPush! I built Graphium because I was tired of spending hours manually reformatting Excel charts to match brand guidelines.