HighlowTicker
Real-time session highs and lows in your terminal
Details
- Follow on
- @marketeyes444
- Target Audience
- DevelopersIndie HackersFounders & CEOs
- Pricing
- One-time from $149.99
Discovery signals
How AI and people discover HighlowTicker on PeerPush
About HighlowTicker
HighlowTicker provides you with real-time session highs and lows directly within your terminal interface. This tool is designed for users who need to track market fluctuations and price extremes without leaving their command-line environment. You can monitor data updates instantly to stay informed on session performance and volatility transitions.
Screenshots
Product Updates (1)
We have migrated to Rust!
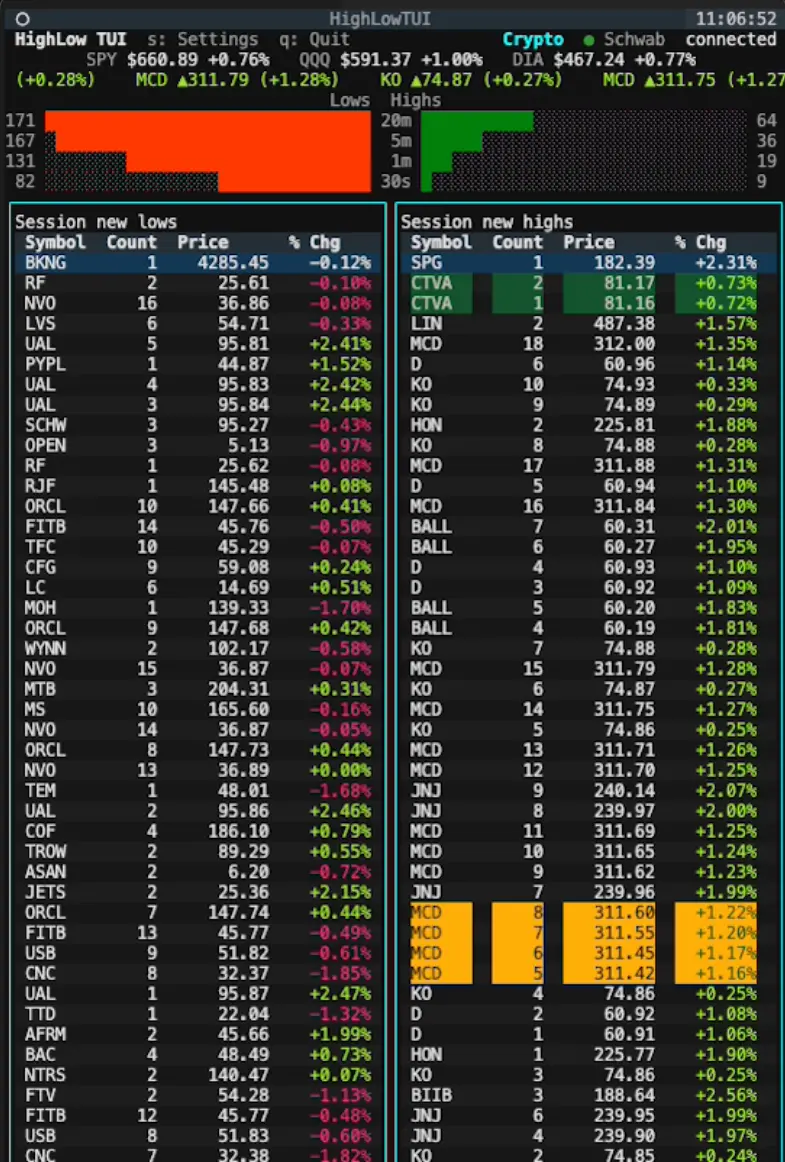
Here’s exactly what you see when you run it: Top bar: HighLow TUI [equity / crypto mode] + live connection status to your broker (Schwab, Tradier, etc.) Index row: Real-time SPY, QQQ, DIA prices updating constantly, Crypto mode shows BTC, ETH, and SOL (customizable soon) Ticker tape: Last 20 entries flowing in from both high and low sides Counting bars: Visual “speedometer” of market activity — when they max out green you’re seeing stocks collectively move higher. When they go grey, the market is quiet (good time to stay patient) Session new lows (red side) + Session new highs (green side) tables with live updates Burst / Spike indicators in the table headers (30s and 5s changes) Bottom metrics: Raw Hz (what the app is actually consuming), Prev 30s average packets/sec, and current table Hz Highlight system that actually pops: Yellow = first appearance on the table (after ~5 min warmup) Orange = 4+ consecutive entries back-to-back (worth a closer look) Pink = volume spike Purple = significant % price move Green = 52-week high Red = 52-week low Everything runs locally, setup wizard launches automatically on first run, and it connects directly to your broker. No heavy GUI, no lag, no subscription. The open-source Python analysis tools that started this whole project are still public (37 stars) if you want to see the roots. If you trade session structure or like seeing market internals in raw terminal form, give the 7-day free trial a spin.
Comments (1)
Reviews (0)
No reviews yet. Be the first to rate this product!
Comments (4)
Strong niche dev-trader tool—bringing real-time session highs/lows directly into the terminal is a clean, focused workflow upgrade. The Rust + broker integration angle makes it feel genuinely performance-oriented rather than just another da
dashboard*
Seeing real-time session highs and lows right in your terminal is very useful for active traders who live in the CLI. Clean, minimal and to the point.
congratulations on launch!
Hello Peers! After blowing another trading account, I put the frustration to work and built something actually for any trader who wants to gauge the market faster than any chart can show.