
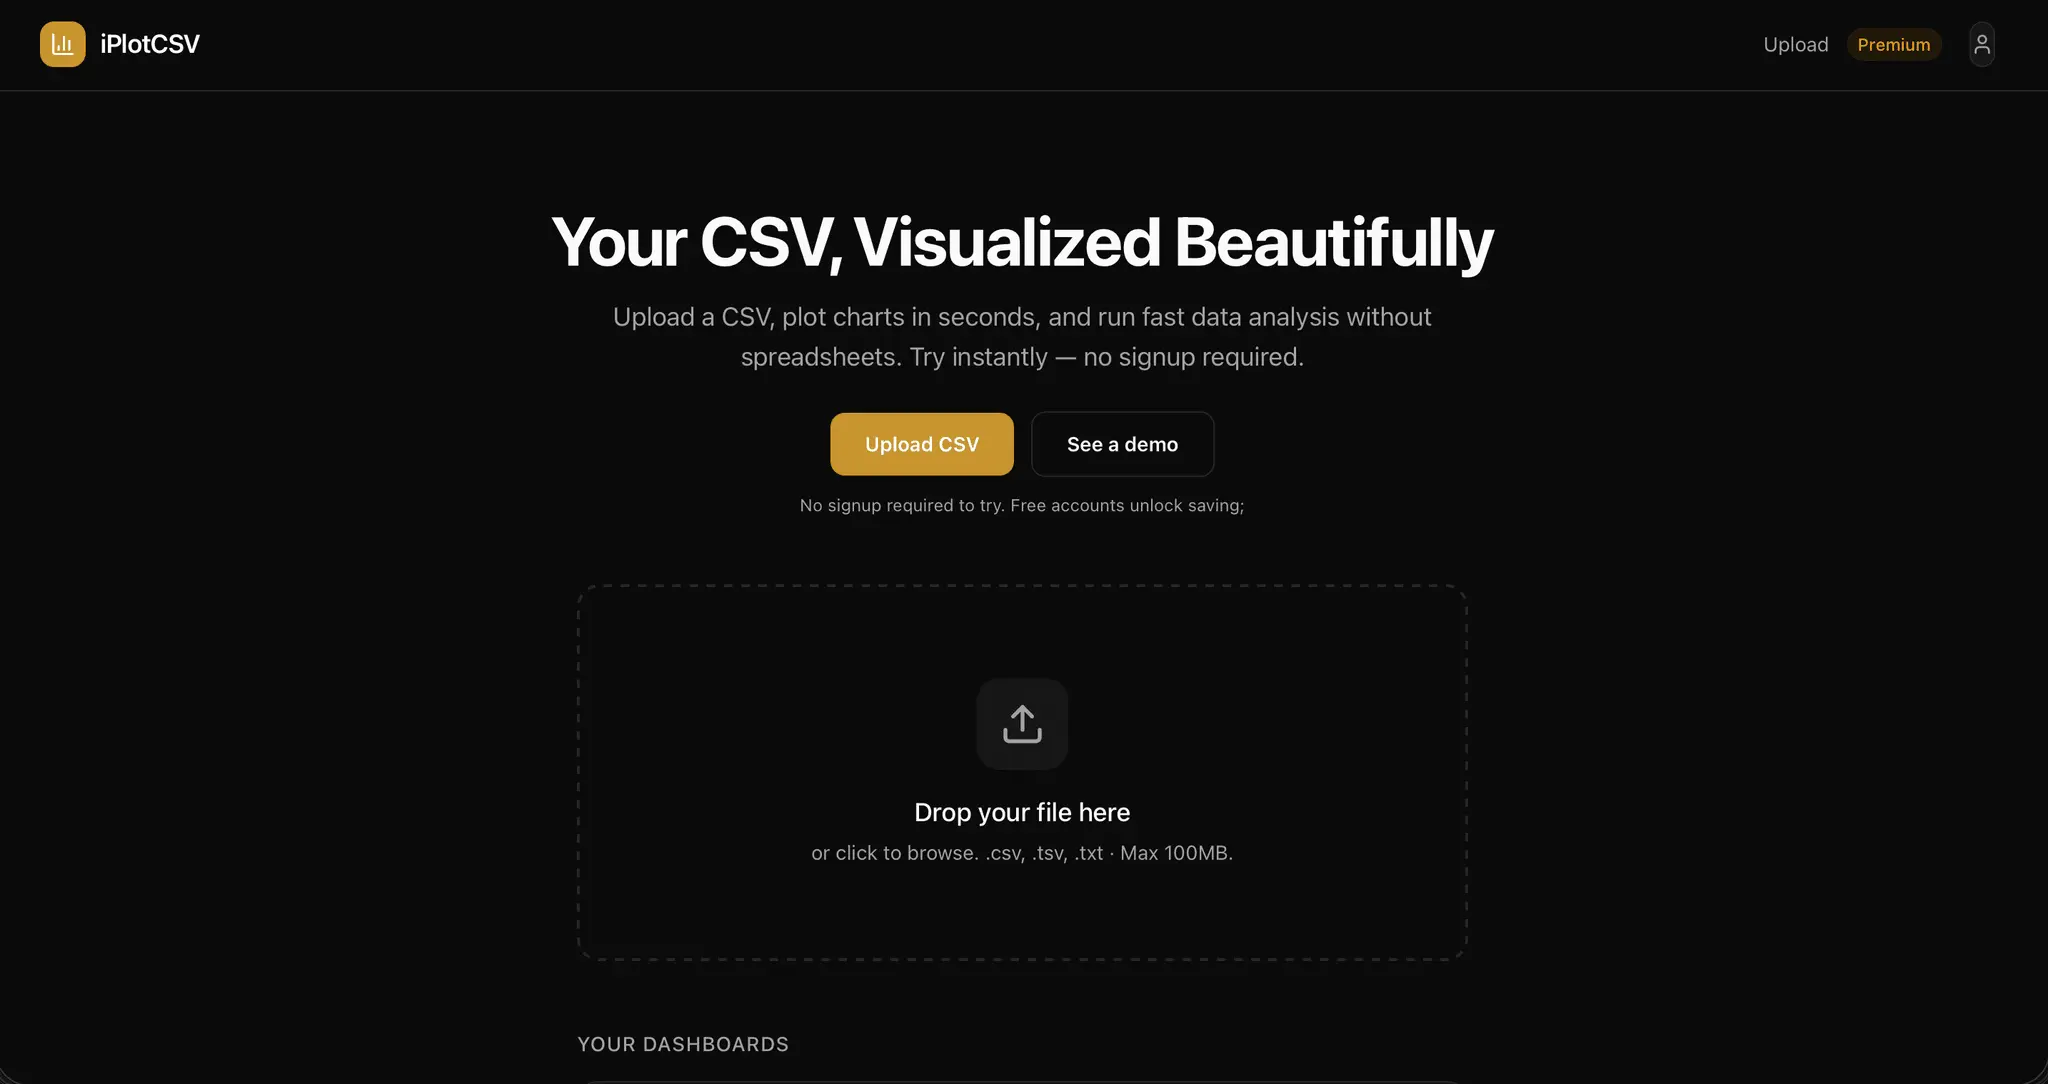
iPlotCSV
Create interactive charts and graphs from CSV files
Details
- Categories
- Design ToolsAnalytics & Monitoring
- Use Cases
- Data AnalysisAnalytics & Reporting
- Target Audience
- Data ScientistsFounders & CEOsNon-Technical Users
- Platforms
- Web
About iPlotCSV
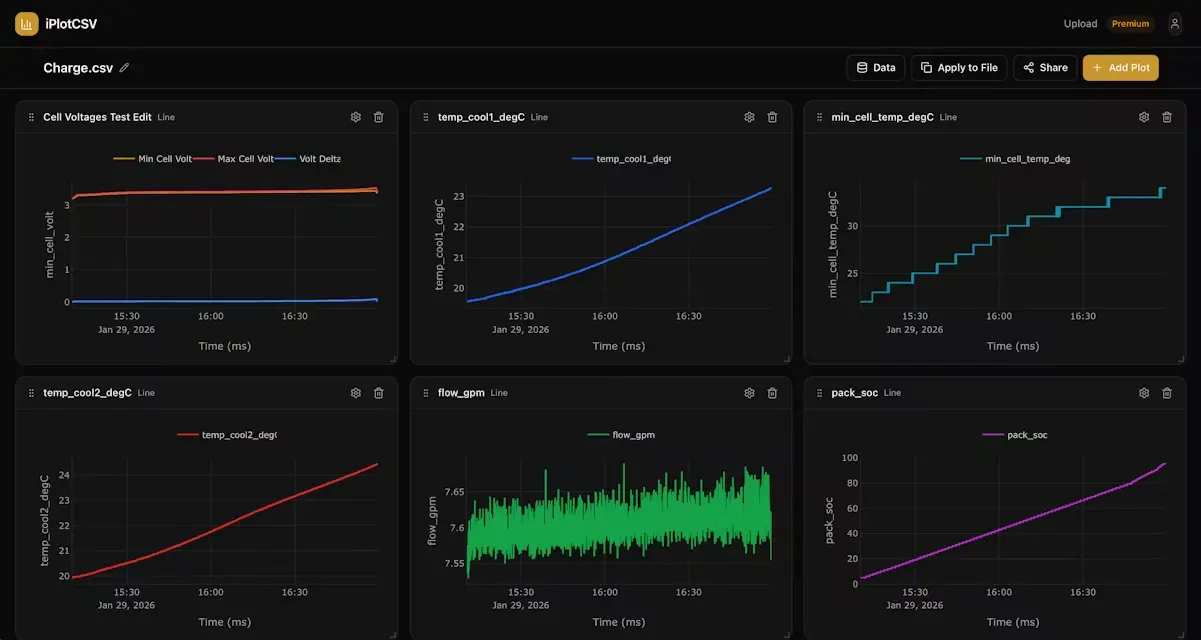
We all know setting up python or creating slow and non interactive charts in Excel sucks. iPlotCSV is a web tool for visualizing CSVs. Drop your file, pick your columns, get an interactive chart. That's it. No signup. Includes a full suite of post processing tools, filters, engineering functions for strain gauges, etc.
Product Insights
iPlotCSV provides a browser-based solution for converting CSV data into interactive visualizations without account registration. It serves as a specialized utility for instant data analysis, offering advanced post-processing tools and engineering-specific functions.
- No registration or signup required for immediate web access.
- Integrated engineering functions specifically for strain gauge data.
- Interactive charting interface that avoids the limitations of static Excel graphs.
- Built-in filtering and post-processing tools for data refinement.
Ideal for: Data Scientists, Founders, and Non-Technical Users who need to generate interactive reports and perform quick data analysis using CSV files.
Screenshots
Reviews (0)
No reviews yet. Be the first to rate this product!
Comments (1)
visit https://iplotcsv.com/demo to try out all features