
PlotYourHome
Home affordability as a color-coded map, not one number

@bainoack
Details
- Follow on
- Categories
- Target Audience
- Pricing
- Free
- Featured in
Discovery signals
How AI and people discover PlotYourHome on PeerPush
About PlotYourHome
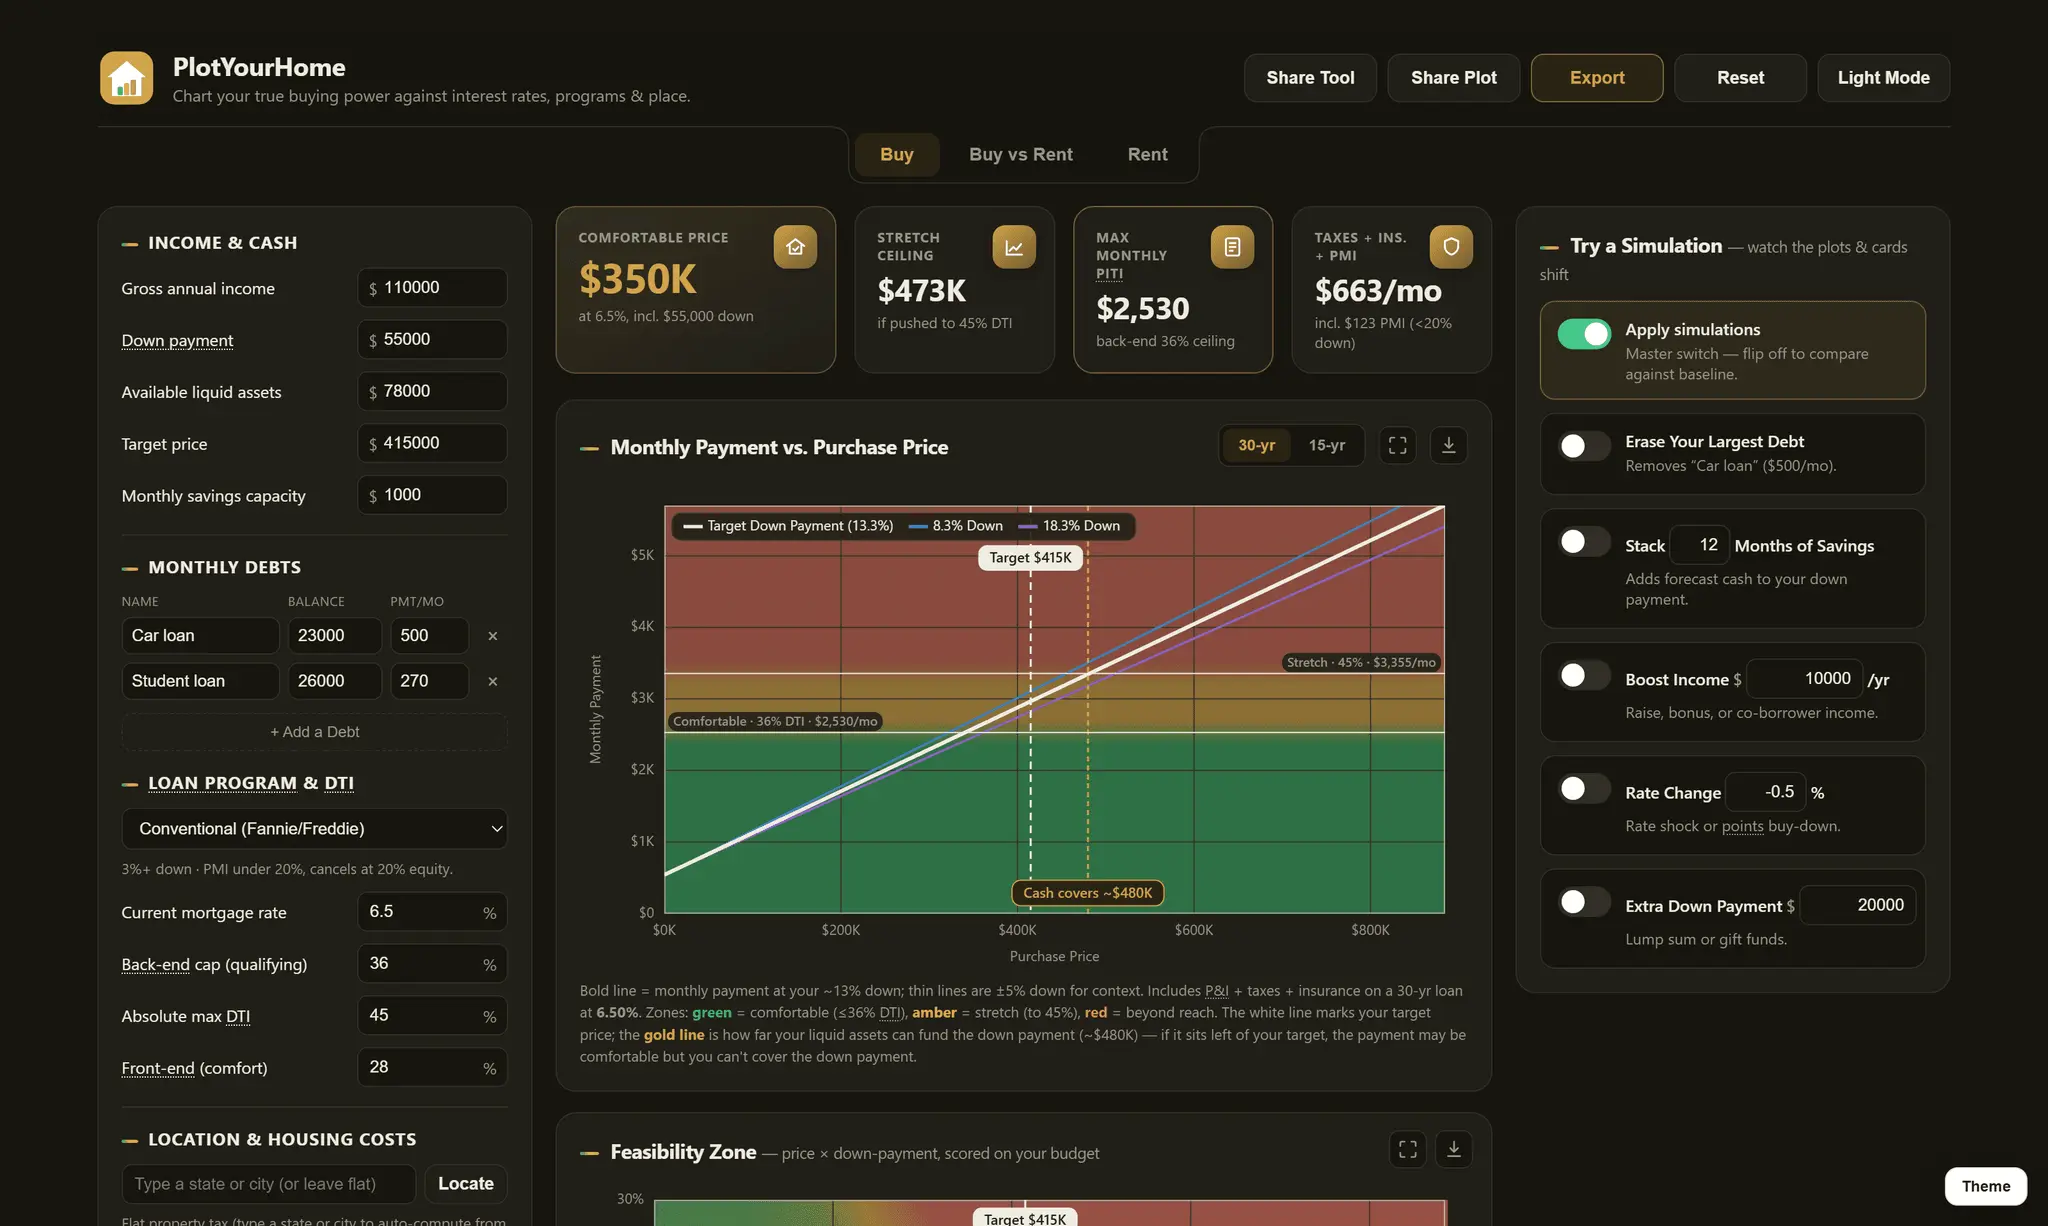
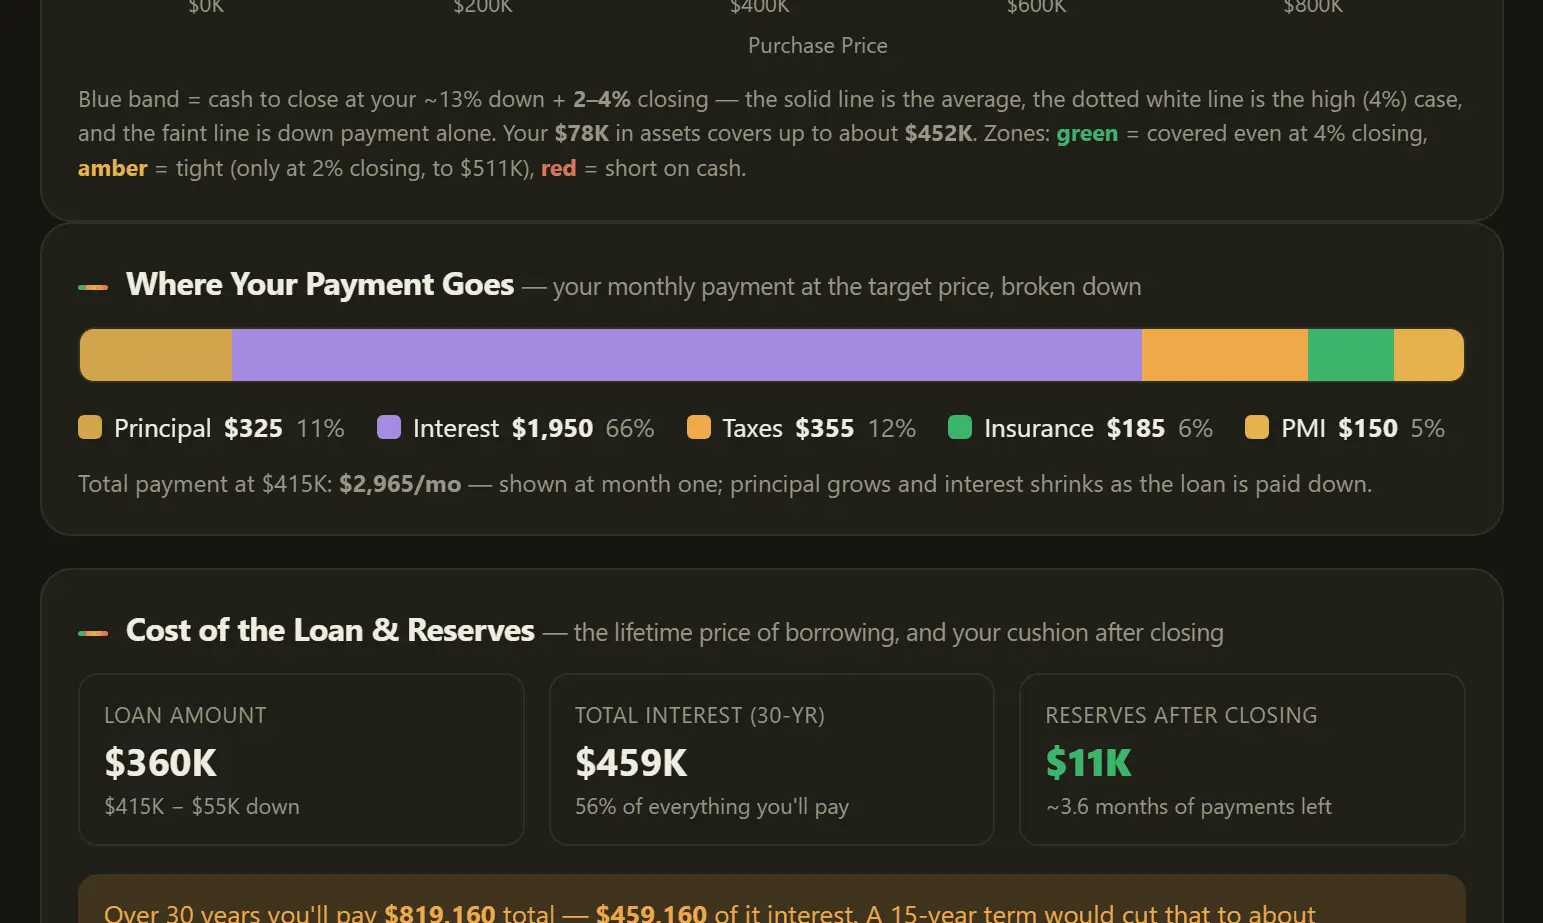
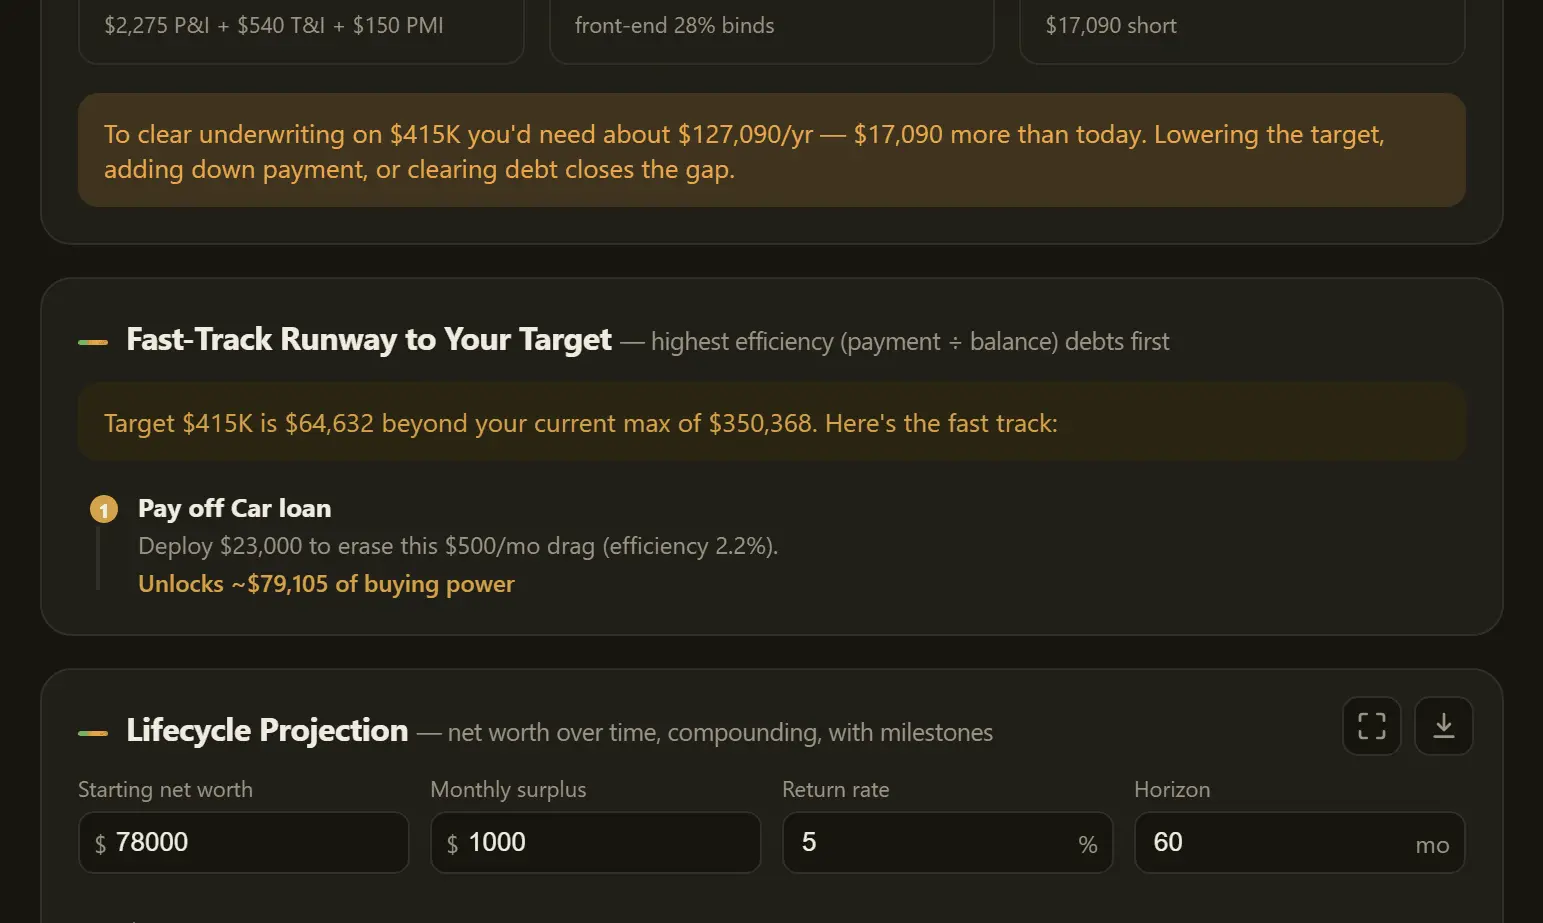
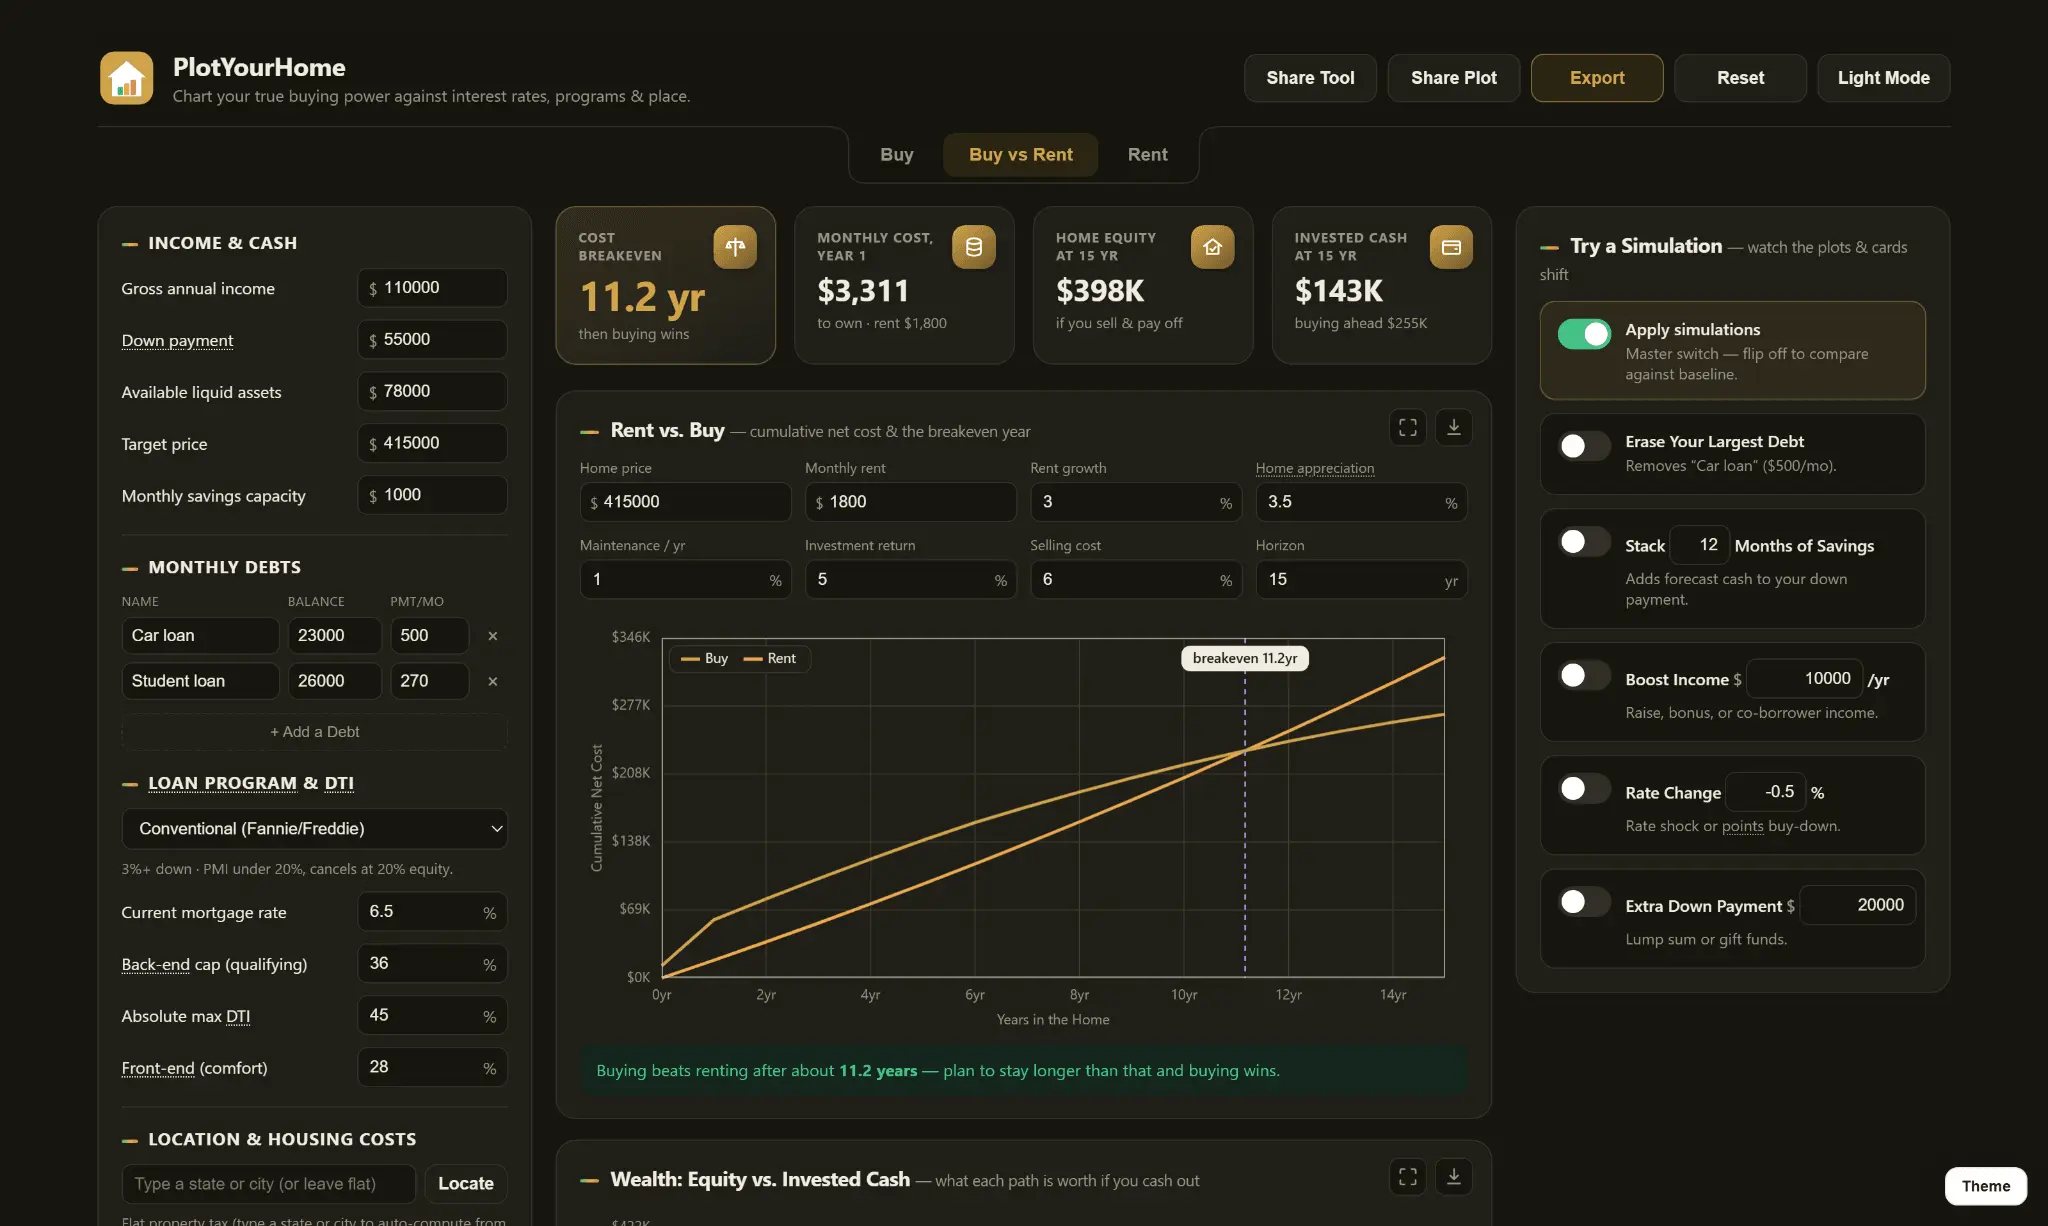
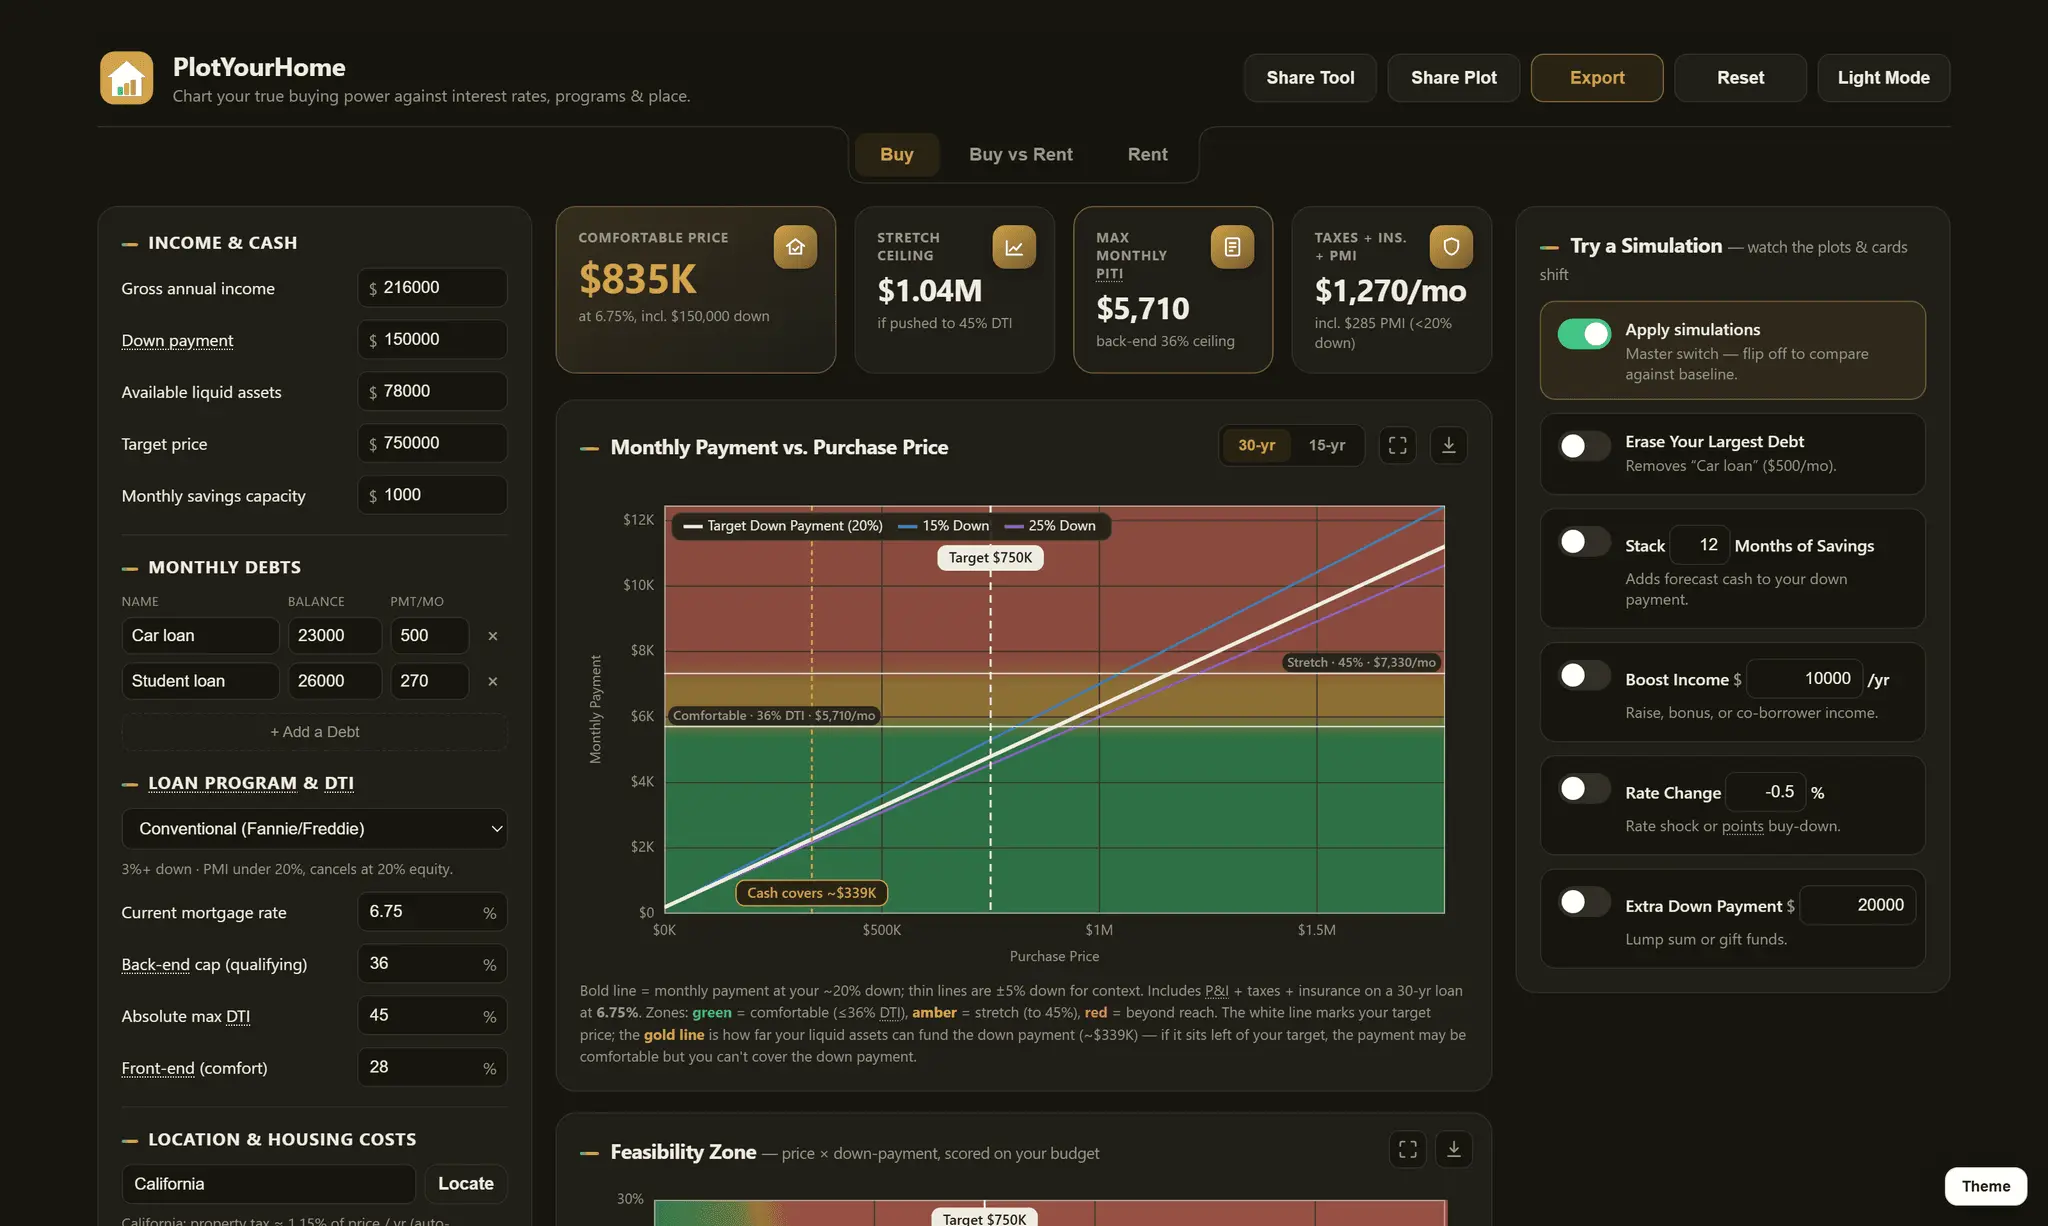
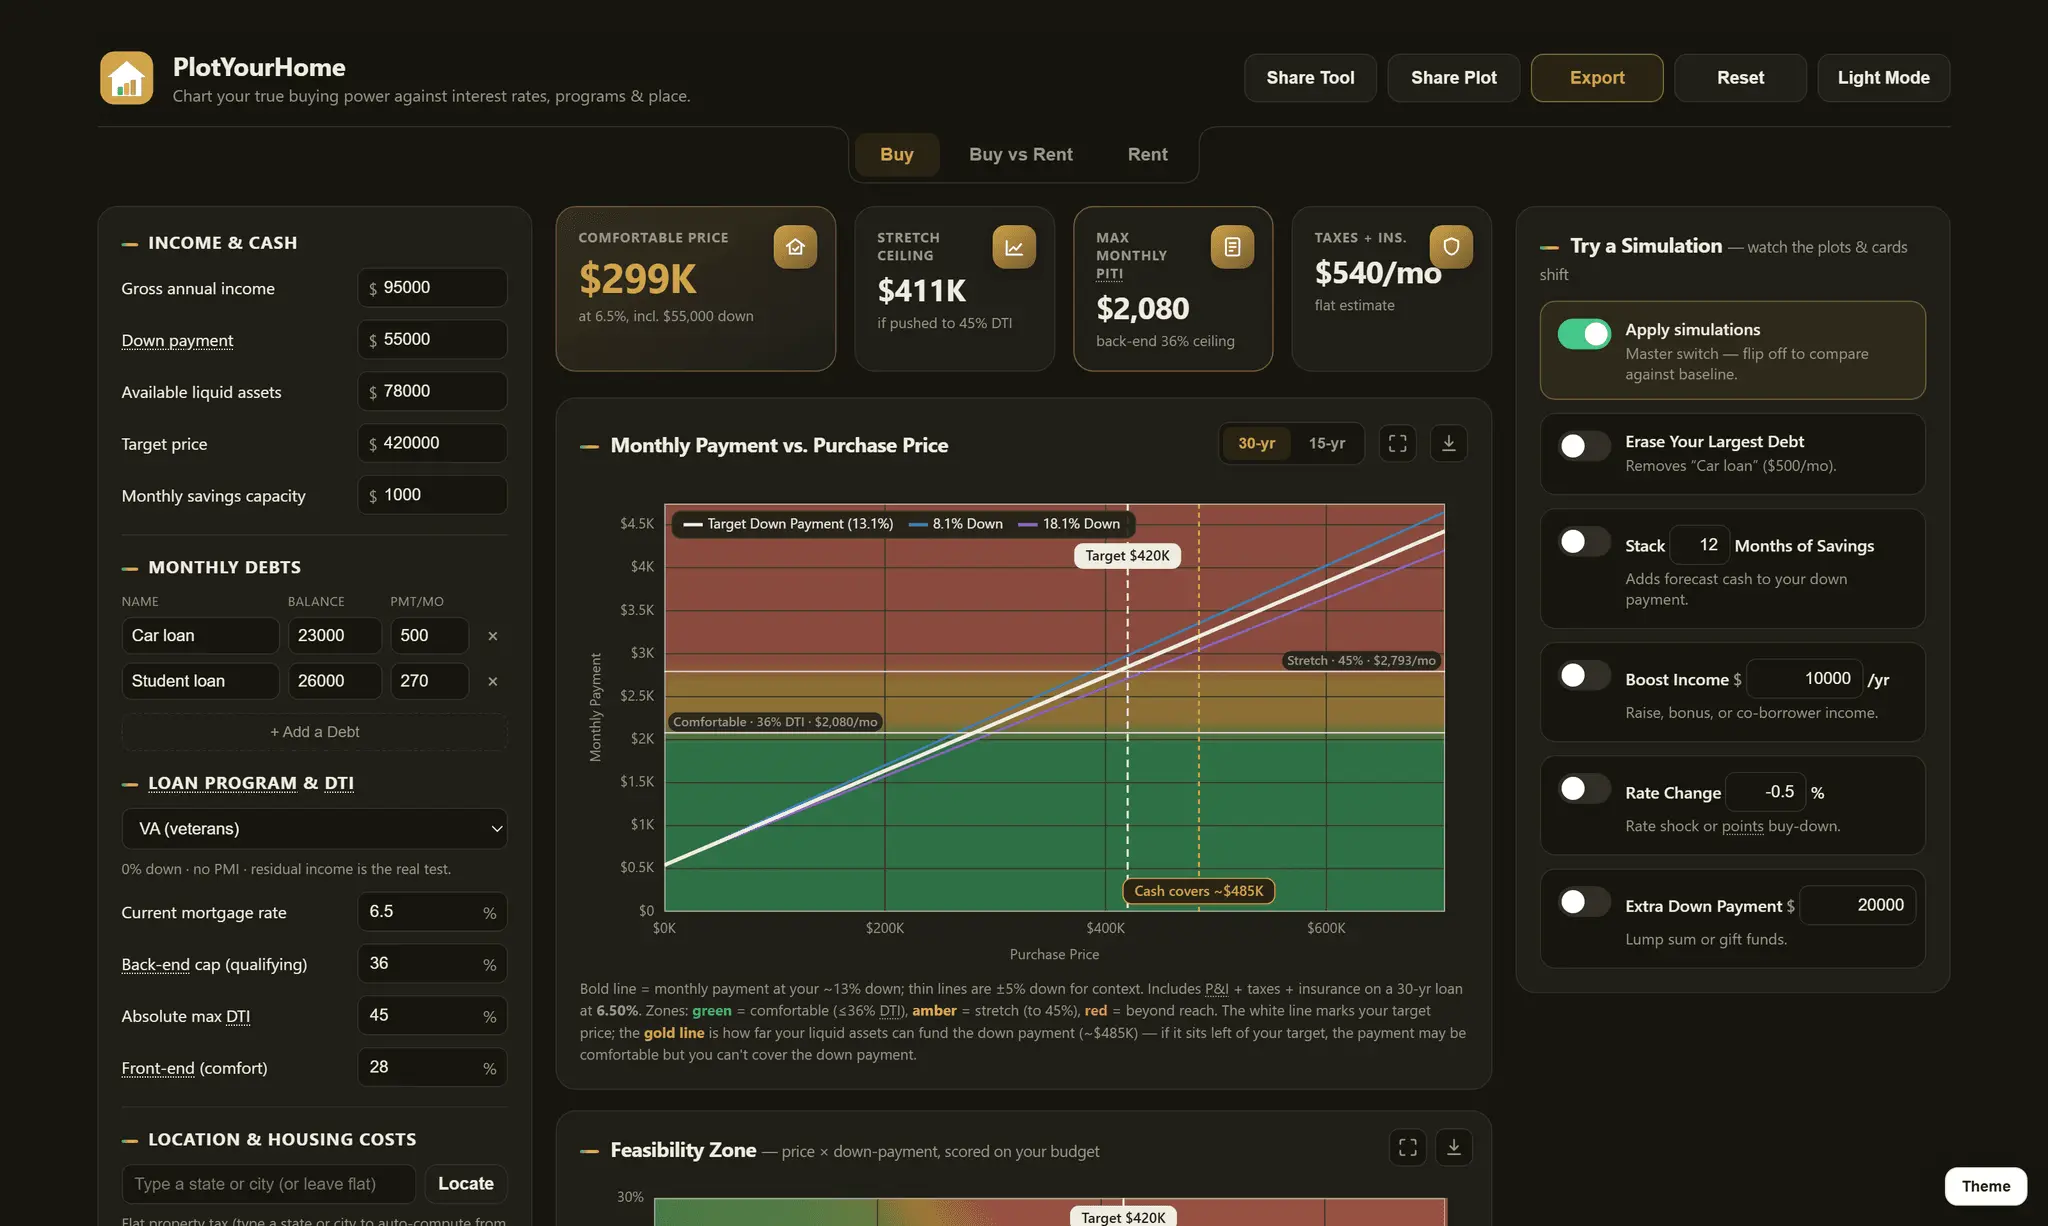
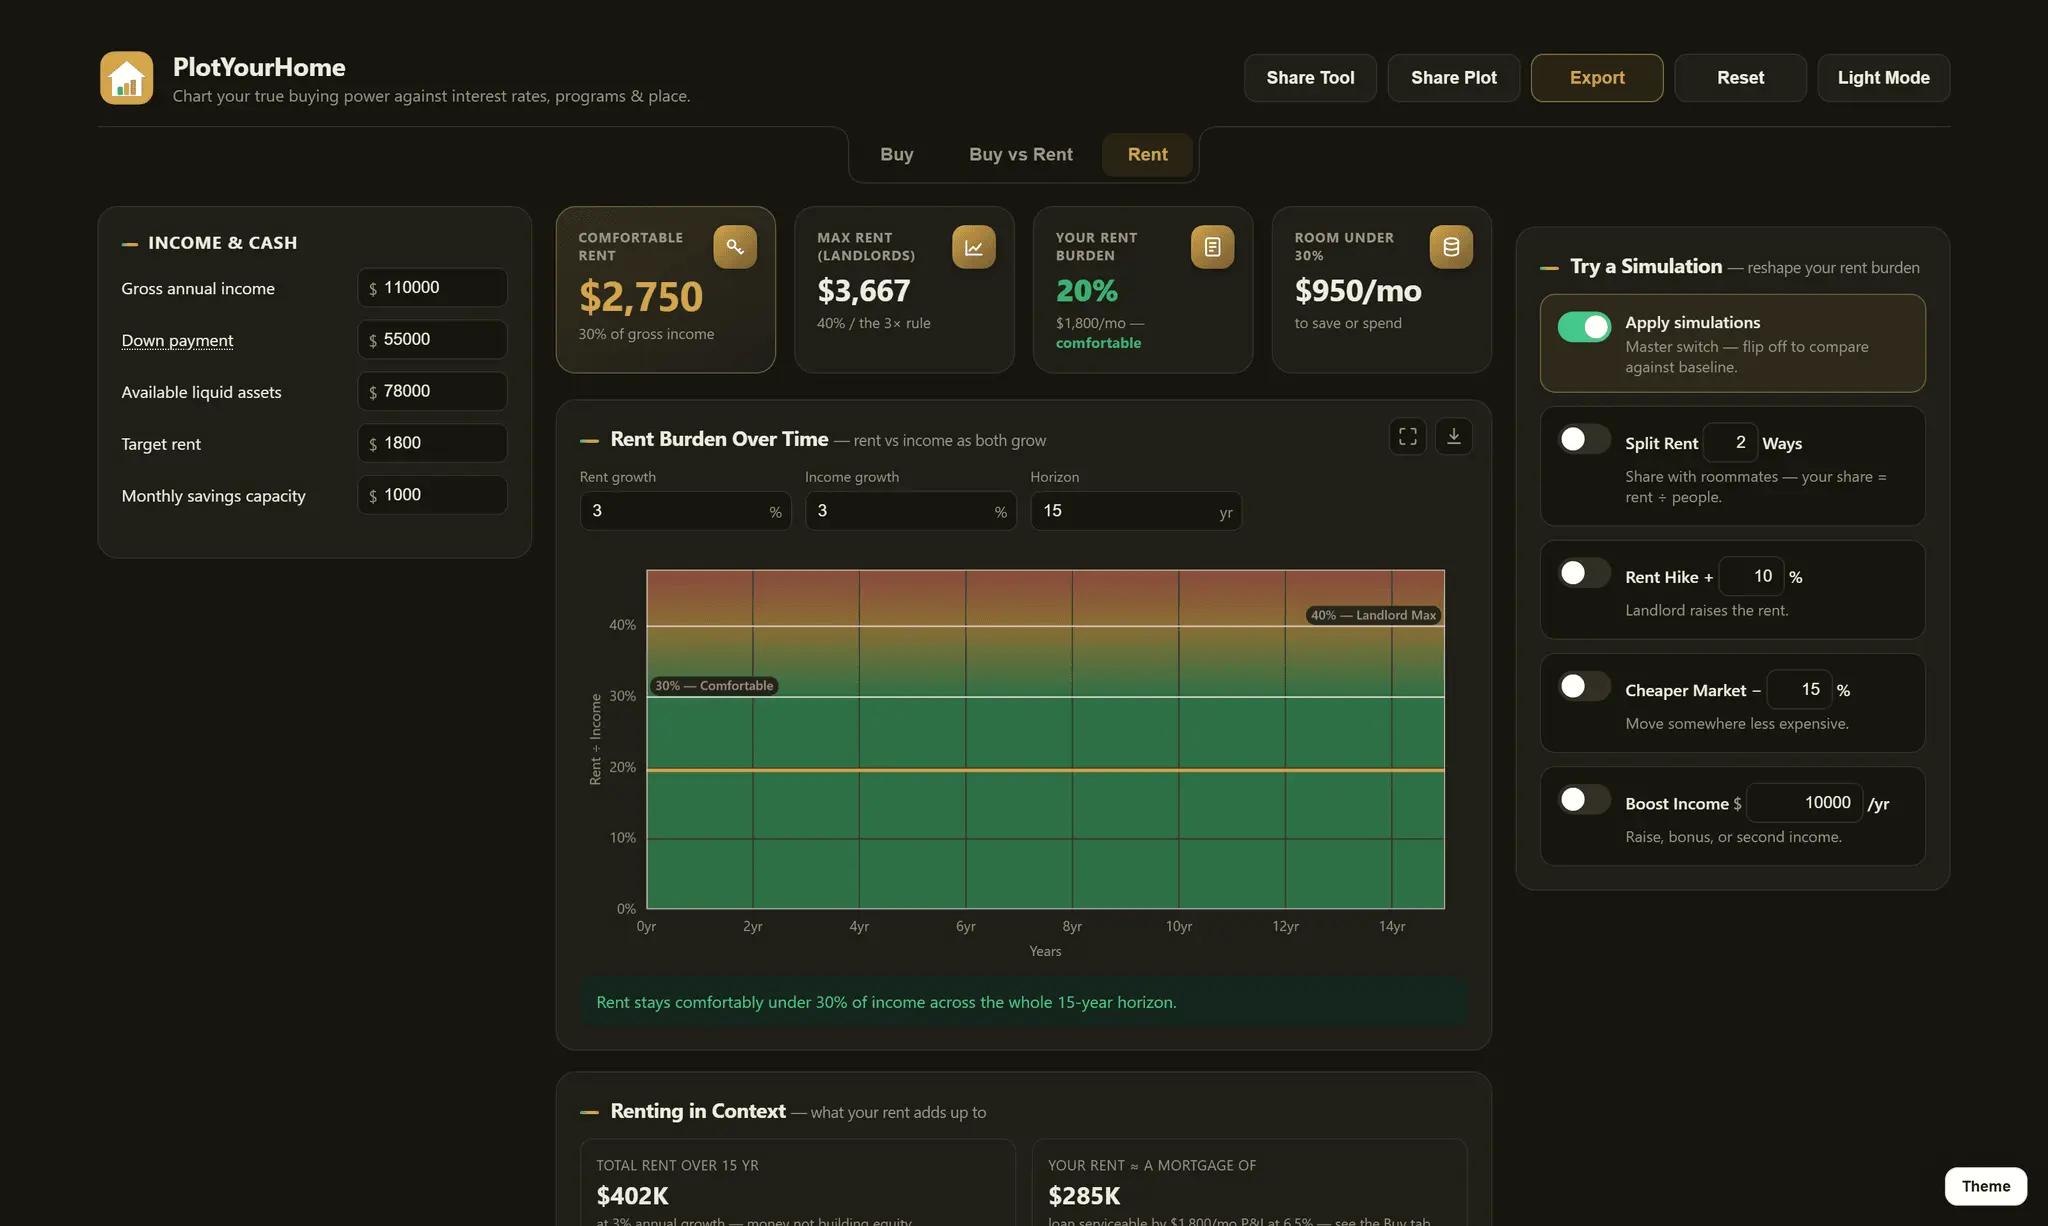
Most calculators hand you one "you can afford $X" and hide the math. PlotYourHome plots your whole budget in green, amber, and red against your real debt-to-income ratio: every price, full PITI, honest zones. Run scenarios live on the plots and determine the quickest path to your goals. Free, no signup, and nothing you type ever leaves your browser.
Screenshots
Reviews (0)
No reviews yet. Be the first to rate this product!
Comments (1)
I built this while working out my own budget. Most calculators give you one number; this plots every price green to red against your debt-to-income ratio. Free, no signup.