
Signara
Agentic Analytics for SMBs
Details
- Categories
- Analytics & Monitoring
- Pricing
- Freemium
- Platforms
- Web
Discovery signals
How AI and people discover Signara on PeerPush
About Signara
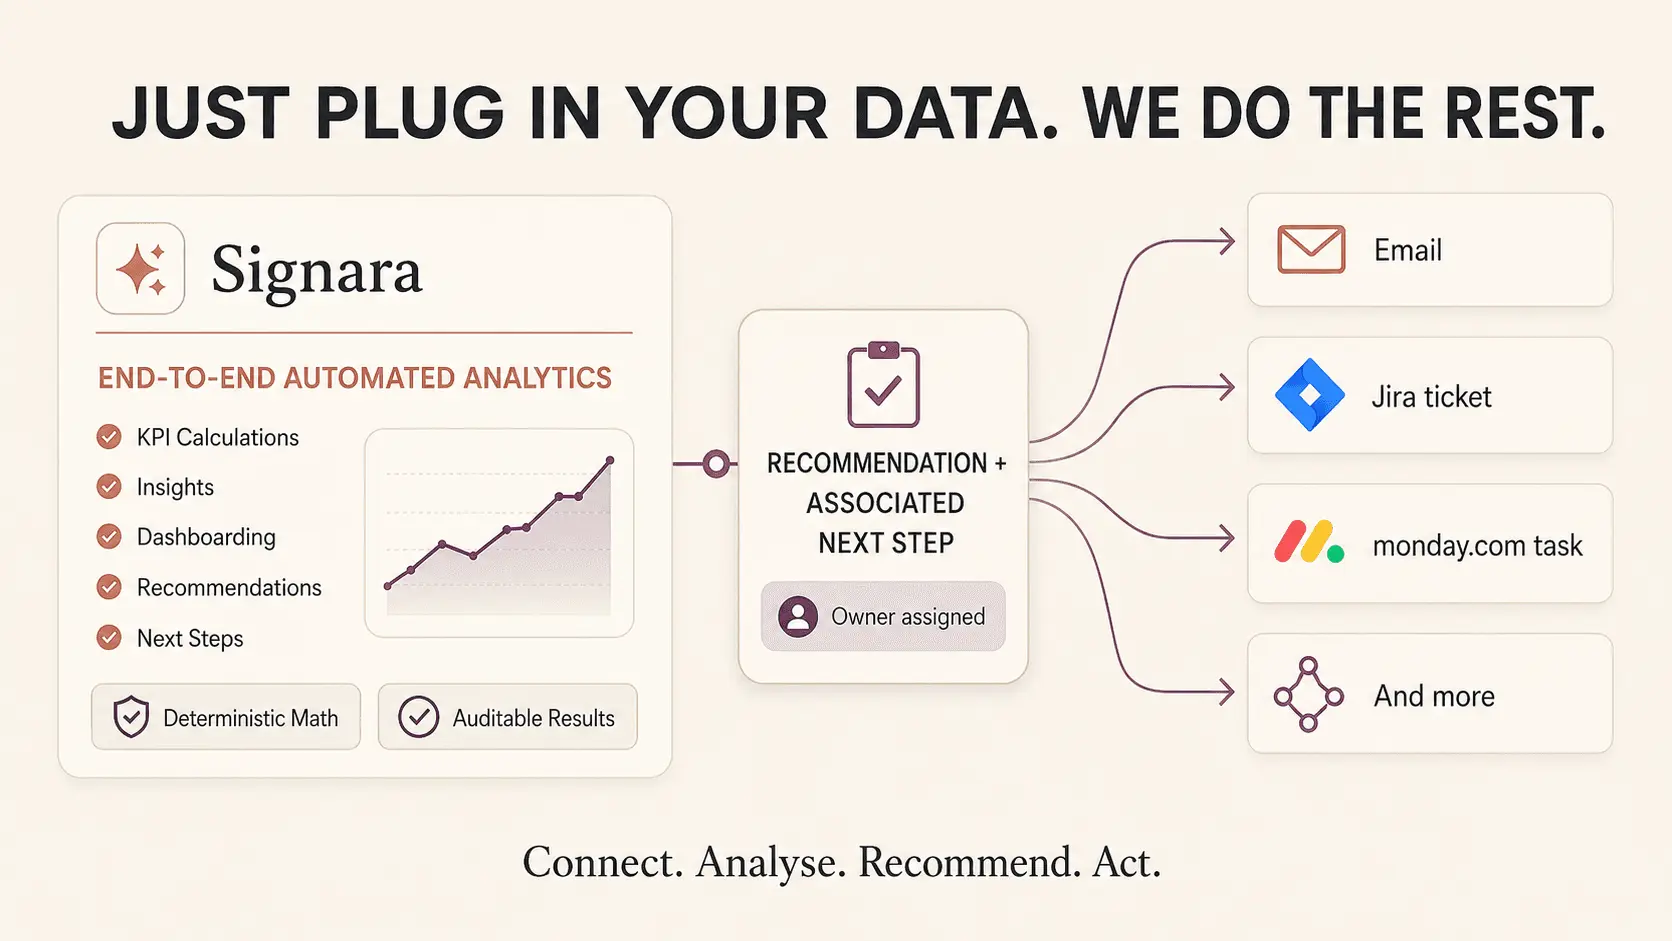
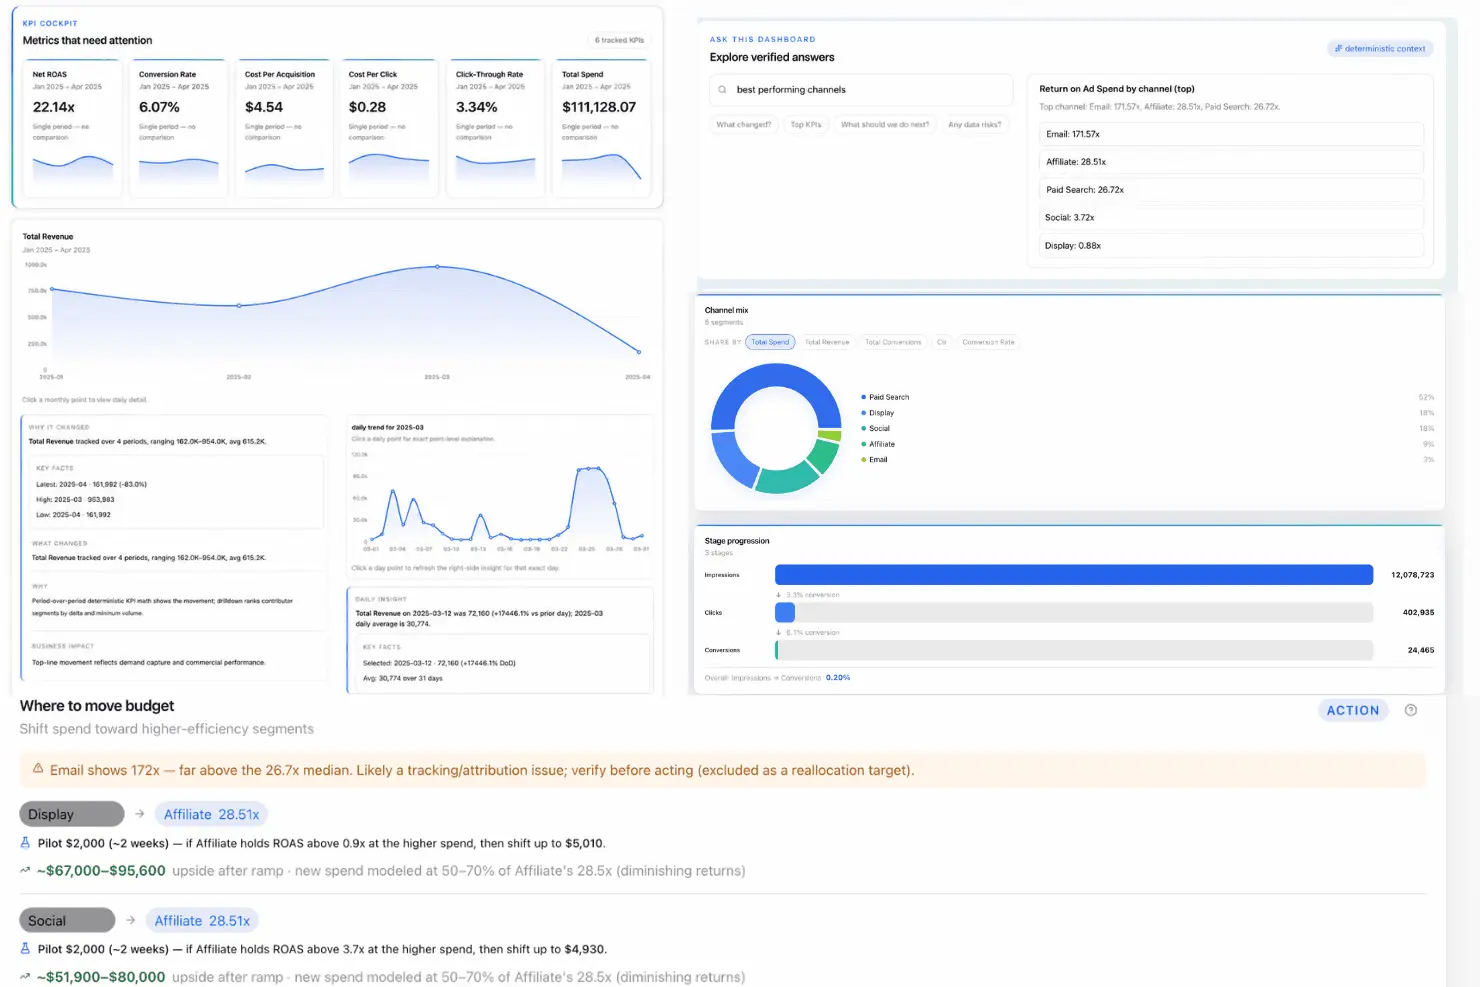
Signara is an agentic analytics platform for SMBs. It automatically turns business data into trusted KPIs, interactive dashboards, executive narratives, insights, recommendations, and next steps without requiring an analyst. For every dataset, Signara identifies the relevant KPIs, investigates what changed and why, and recommends specific actions based on the business domain. Signara turns those recommendations into assigned action. Users can assign a next step to an individual or team, create the task in Jira, Monday.com and more, or notify the relevant people by email. Every calculation is deterministic and auditable. Metrics reconcile directly to the source data, so AI explains the results but never invents the numbers. Signara also checks data quality and flags integrity issues that could affect the analysis. Connect data from HubSpot, Google Sheets, Excel, BigQuery, Snowflake, Databricks, PostgreSQL, MySQL, CSV, and more. Signara is also available as a connector in Claude, allowing users to run analytics and reporting tasks directly from Claude. A free tier is available with no credit card required. Signara is a modern alternative to Tableau, Power BI, Looker Studio, DashThis, and Klipfolio for teams that want more than dashboards. It automates reporting, interpretation, root cause analysis, recommendations, ownership, and task creation in one workflow, taking businesses from raw data to decisions and assigned action.
Product Video
Watch a video demo of Signara.
Screenshots
Reviews (4)
Average 4.5 out of 5
Based on 4 reviews
Really amazing and good establishment

Looks like a good solution. The only thing missing is security and how that is handled.

Plug in your data, get a dashboard with KPIs and narrative explanations. The deterministic math piece is genuinely useful, numbers match source data every time. Saves the team real hours each month on client reports. Setup was quick and the narrative explanations on each chart mean non-technical stakeholders don't need someone walking them through the numbers.
Comments (3)
Reports that explain themselves remove the interpretation gap between data and decisions. At Bunzee we think the same way about market signals. Which report type do users find most valuable when there is no analyst to guide them?
@trades Thanks, appreciate the review. Security is something we’ve been careful about from day one, especially around how customer data is accessed, handled, and stored within the platform.
Plug in your data, dashboard runs itself. The narrative explanations on each chart are the standout for me. Solid for recurring client reporting.